 Quantority
USELESS liquidations wipe out shorts: -1.00 imbalance over 24h
$275 in longs vs $0 in shorts liquidated in the last 24 hours.
 USELESS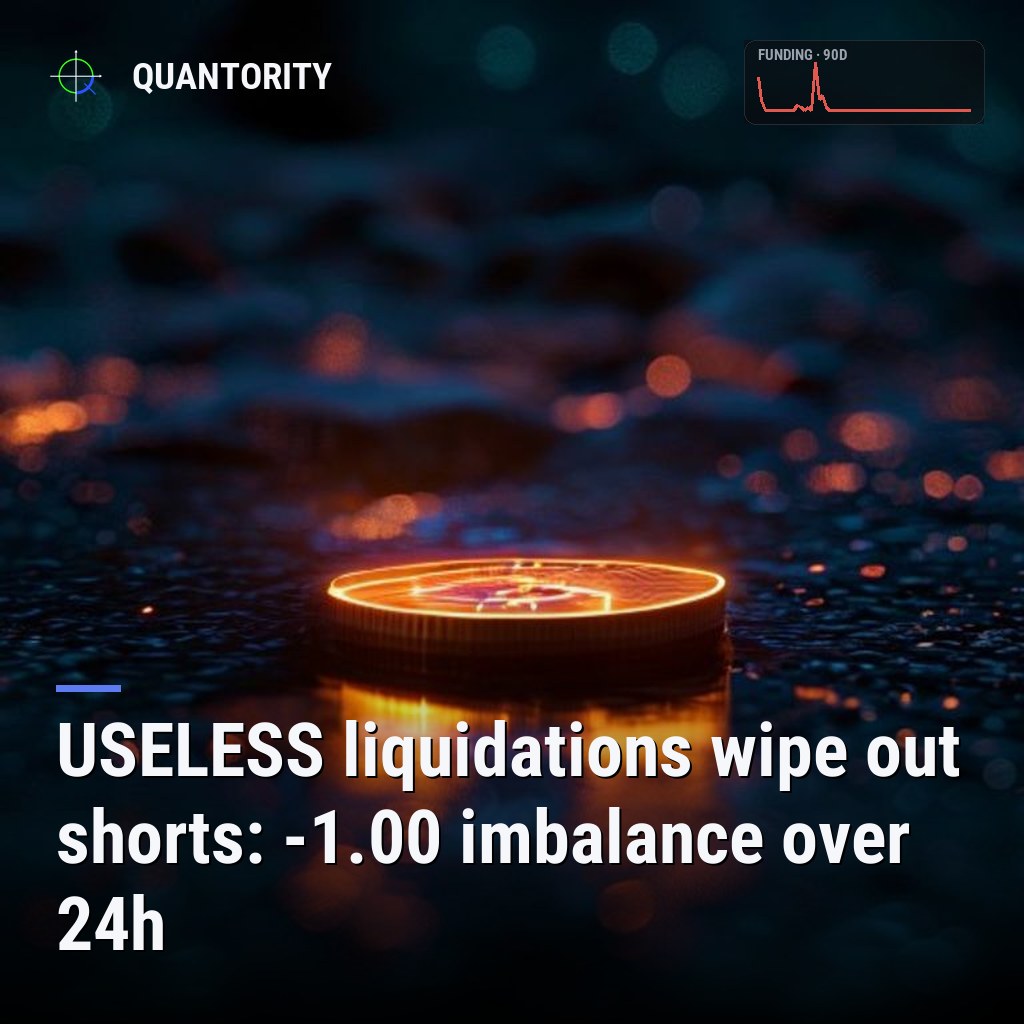
- •USELESS leads with 42 leverage risk.
- •1 market covered · data as of Jul 12, 2026.
| Coin | Funding APR | Pctile 90d | Open interest | OI 24h | Risk |
|---|---|---|---|---|---|
| USELESS | 10.95% | 0 | $10.9M | +0.3% | 42 |
USELESS presents a paradox: its aggregated funding rate is materially positive at 10.95%, yet this apparent crowding sits at the absolute bottom of its 90-day range. The coin's leverage risk score of 42 is moderate, and open interest remains muted. What emerges is a market where the funding signal and its historical context diverge sharply—a condition worth examining for what it reveals about positioning fragility and near-term rebalancing risk.
Key takeaways
- Funding rate of 10.95% is positive and significant, indicating longs currently pay shorts, yet ranks at the 0 percentile over 90 days—historically unremarkable for USELESS.
- Open interest is modest at $10.9M with only +0.3% growth in 24 hours; 7-day momentum is unavailable, suggesting minimal recent leverage accumulation.
- Liquidation imbalance stands at -1.00, meaning shorts faced complete liquidation pressure over 24 hours with no offsetting long liquidations—an extreme skew.
- Leverage risk score of 42 is moderate, not elevated, indicating the overall fragility of the positioning is restrained despite the directional signals.
Funding disconnect from recent history
The funding rate's 10.95% APR tells a straightforward story: long positions in USELESS are presently more crowded than shorts, and longs are paying shorts to hold. In isolation, this is a crowding signal. However, when that rate is placed at the 0 percentile of the prior 90 days, the narrative flips. A percentile of 0 means today's funding sits at or below the lowest point in recent memory for this coin.
At the 0 percentile, today's 10.95% funding is the least stretched it has been in three months—a potential warning that perception lags reality.
This inversion—high nominal funding coupled with the lowest recent ranking—suggests that either USELESS's funding has undergone a recent shift that has not yet been priced into derivative positions, or that long crowding, while present, is not unusual relative to the coin's own volatility. For traders accustomed to reading funding as a proximity signal, this is a red flag: you cannot rely on "high funding = crowding" in isolation when the 90-day context shows this is actually the calmest state the market has seen in months.
Open interest: quiet and stable
The open interest picture reinforces the sense of restraint. At $10.9M across all exchanges, USELESS holds a modest notional position. The 24-hour change of +0.3% is nearly flat—positions are neither being built nor rapidly unwound. The 7-day open interest change is listed as unavailable, so we cannot assess whether last week brought any meaningful leverage shift; however, the stillness over the most recent day suggests that traders are not aggressively entering or exiting.
This stability is consistent with a market where positioning is not accelerating into crowding. If USELESS were seeing a surge in leverage, we would expect larger 24-hour moves in open interest, not a fraction of a percent. The modest pool also means that even moderate liquidation events would have outsized impact on price, a structural risk even when absolute positioning is small.
Liquidation imbalance: the extreme signal
Where the data becomes striking is the liquidation imbalance of -1.00 recorded over 24 hours. A value of -1.00 indicates that shorts faced liquidation pressure and longs did not—a complete one-directional skew. This is not a balanced market clearing; it is a scenario where leveraged shorts have been wiped out while long positions have persisted.
This imbalance is the sharpest warning flag in the dataset. It suggests that recent price action has favored longs, and that shorts positioned with inadequate margin have been forced to capitulate. The combination of short liquidations with modest overall open interest growth (and a historically low funding percentile) paints a picture of acute directional weakness in short positioning rather than structural leverage accumulation.
Moderate risk score, contradictory signals
The leverage risk score of 42 ranks as moderate—neither elevated nor low. This composite measure reflects the tension visible in the other fields: there is directional imbalance (favoring longs, as shown in funding and liquidations), but the absolute size of positioning is constrained, and the historical context is calm. The risk score's moderation may be anchored to the small open interest pool; even when directional, small positions pose less systemic pressure than large ones.
Traders should read this score not as "safe" but as "manageable given size." A leverage risk of 42 on a $10.9M book is different from the same score on a $1B book.
What would change this read
Three concrete data shifts would materially alter this picture. First, if the funding percentile were to rise sharply—moving from 0 to, say, the top quintile—it would signal that today's 10.95% funding is becoming unusual relative to recent history, implying fresh long crowding. Second, if open interest reversal occurred, with the 7-day change data returning and showing a sharp jump, that would indicate new leverage entering the market. Finally, if the liquidation imbalance flipped to positive values consistently, it would mean longs are being wiped out and shorts are accumulating again, invalidating the current short-weakness story. None of those conditions are present in today's data.
*Analysis generated from Quantority's live cross-exchange data pipeline. Descriptive market data, not a trade recommendation.*
Funding-spike and liquidation-cascade alerts the moment they fire, plus unlimited history and a REST API.
See what's in Pro→How to read this
| Funding APR | Annualized, OI-weighted funding. Positive = longs pay shorts (crowded longs). |
| Percentile 90d | Where current funding sits within the coin's own last 90 days (0–100). |
| Open interest | Total USD value of outstanding perpetual contracts. |
| OI change 24h / 7d | How fast leverage is entering (+) or unwinding (−) over the period. |
| Liquidation skew | Imbalance of forced closures (−1…1): + = more longs liquidated, − = more shorts. |
| Leverage risk | 0–100 composite of funding extremity, OI momentum, liquidations and volatility. |
Read next
 BICO
BICO
BICO liquidations wipe out shorts: -1.00 imbalance over 24h
$4,190 in longs vs $0 in shorts liquidated in the last 24 hours.
 OPG
OPG
OPG liquidations wipe out shorts: -1.00 imbalance over 24h
$1,401 in longs vs $0 in shorts liquidated in the last 24 hours.
 FARTCOIN
FARTCOIN liquidations wipe out shorts: -1.00 imbalance over 24h
$1,843 in longs vs $0 in shorts liquidated in the last 24 hours.
Diego covers crypto derivatives markets for Quantority, reporting on liquidation cascades, exchange volume shifts and funding-rate moves. He writes descriptively and avoids price predictions.
Stretched markets, building leverage and the research worth reading — one short email.
Every figure here is read directly from Quantority's cross-exchange data. This is descriptive market analysis — a read on positioning, not a forecast, and not financial advice.