 Quantority
The leverage risk score, explained
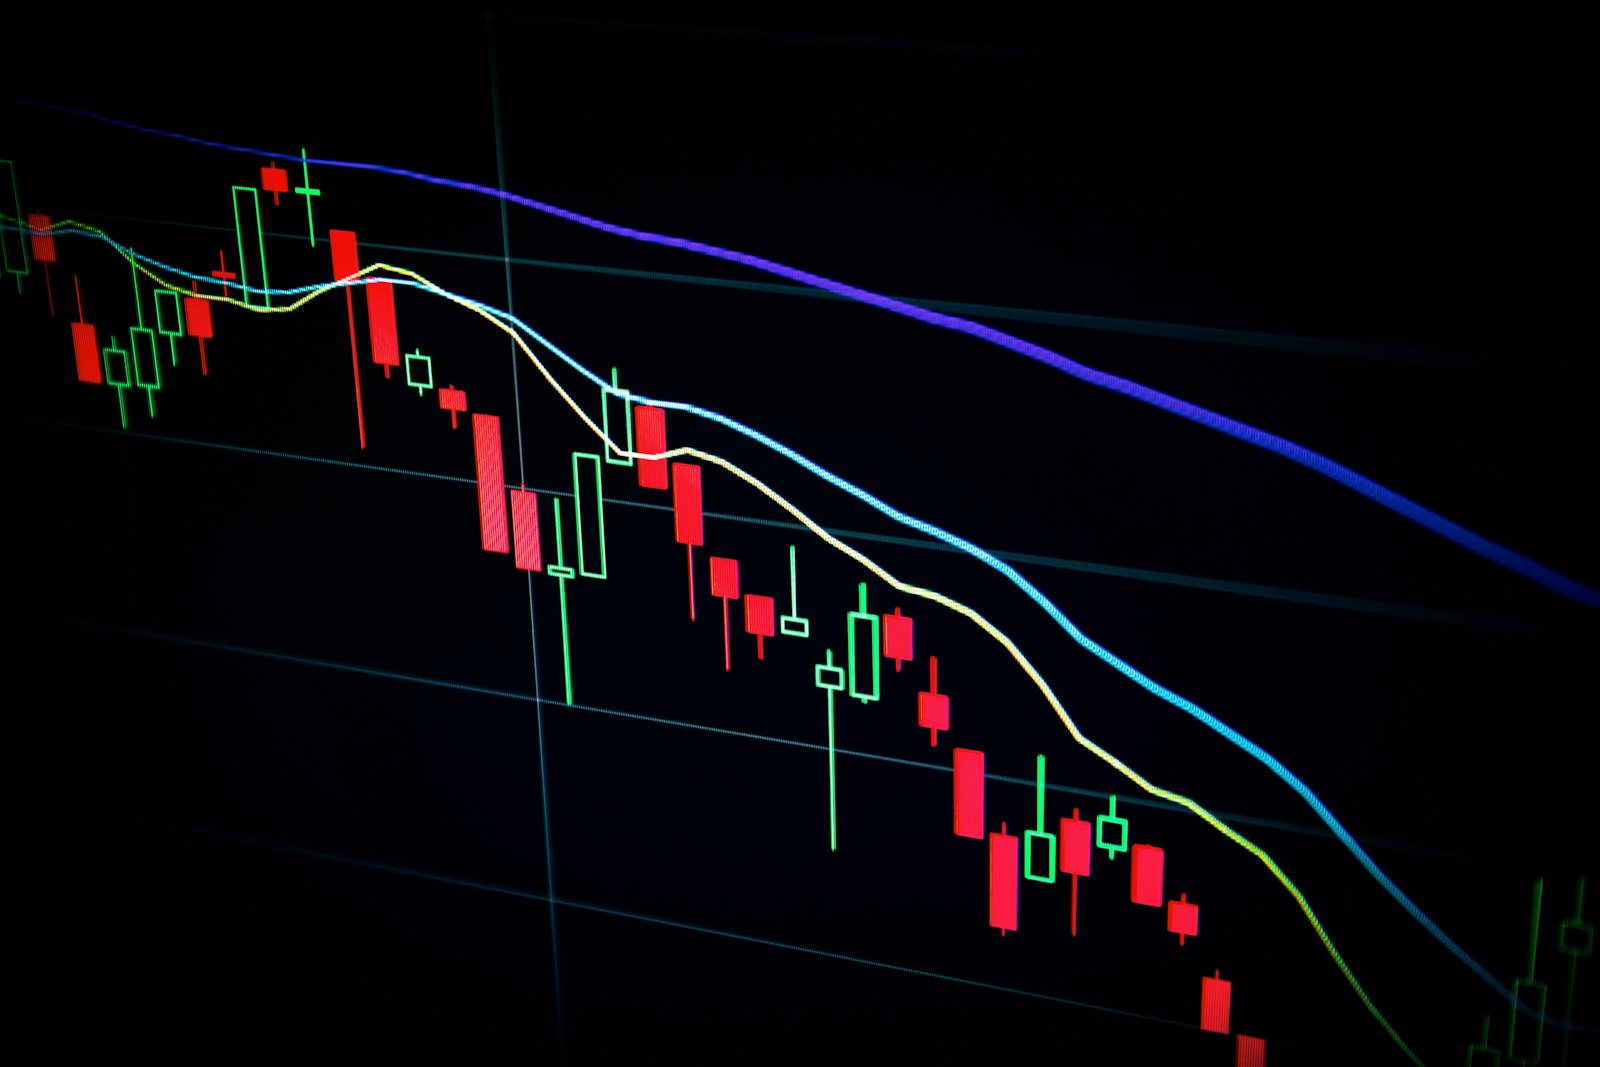
Funding, open interest, liquidations and volatility each tell you something about a market — but no single one captures how stretched positioning is. The leverage risk score combines them into one 0–100 reading: higher means more fragile to a sharp move.
The four components
Funding extremity (weight 0.35) measures how far funding sits from neutral in either direction. OI momentum (0.25) captures how fast open interest is building. Liquidation pressure (0.20) is recent liquidations relative to open interest. Realized volatility (0.20) is how violently price has been moving.
How they combine
Each component is normalized to 0–1 and clamped, then weighted and re-normalized over whichever components have data — so a coin missing liquidation data isn't unfairly penalized. The full formula and thresholds are on the methodology page.
How to use it
Use the score to compare coins and to flag when a market is heating up — sort the screener by risk, or open a coin's risk page. It is descriptive, not predictive: a high score flags fragility, not a guaranteed move, and nothing here is financial advice.
Keep exploring
Every perpetual, sortable by funding, OI and risk.
Leaderboards for funding, OI momentum and risk.
Put two coins side by side across every metric.
Plain-English guides to every metric we track.
Quick definitions for derivatives terms.
Exactly how each number is computed.
Funding extremes, OI surges and liquidation cascades — pushed the moment the data moves.