 Quantority
ETHFI open interest drops -48.3% in 24h as leverage unwinds
Total ETHFI open interest now stands at $21.0M. Funding is 10.95% annualized.
 ETHFI
ETHFI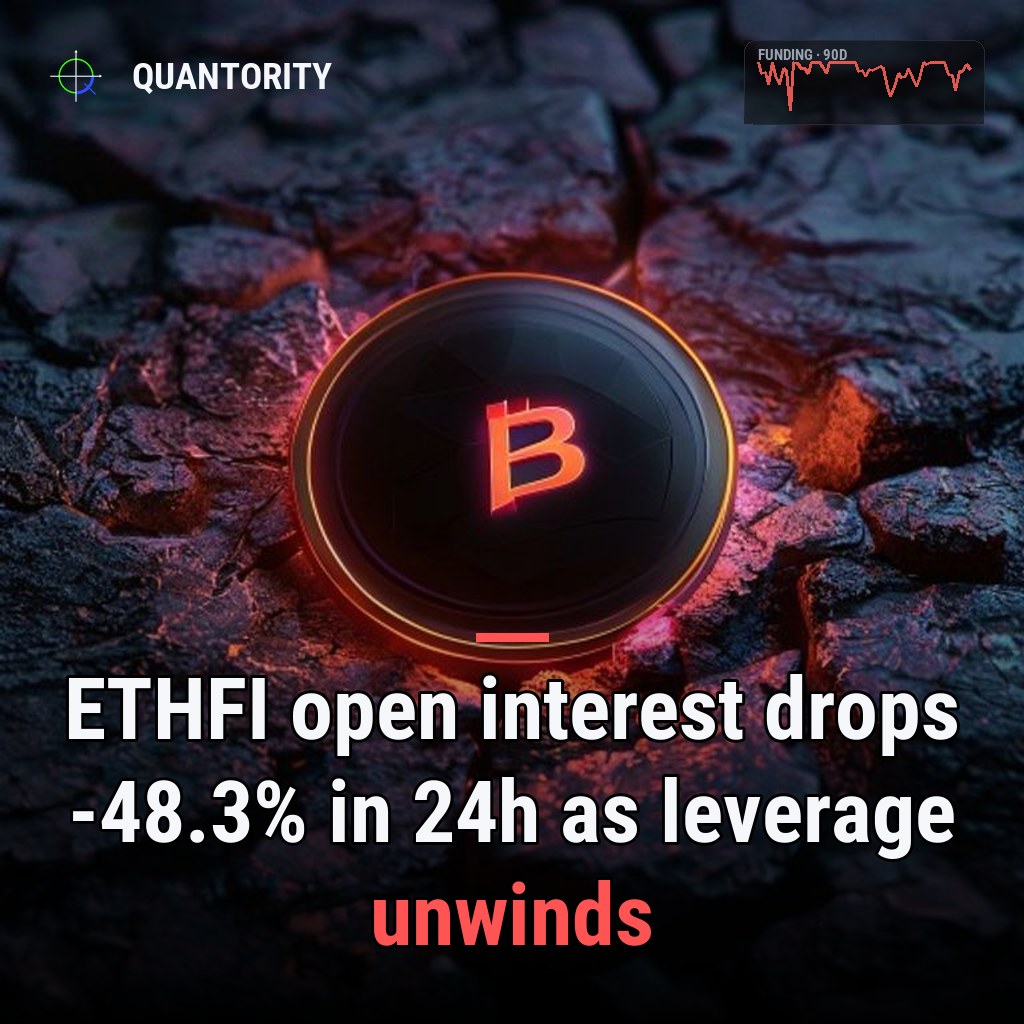
- •ETHFI leads with 53 leverage risk.
- •1 market covered · data as of Jul 17, 2026.
| Coin | Funding APR | Pctile 90d | Open interest | OI 24h | Risk |
|---|---|---|---|---|---|
| ETHFI | 10.95% | 100 | $21.0M | -48.3% | 53 |
ETHFI's derivatives market is sending conflicting signals. Funding rates have reached their absolute peak relative to the past 90 days, yet open interest has just undergone a severe single-day contraction. This collision between stretched rate economics and rapid deleveraging suggests a market caught between crowded positioning and active position exit — a state that demands close attention from leverage traders and risk monitors.
Key takeaways
- Funding rate sits at 100 percentile of its 90-day range, meaning ETHFI has never been more expensive to hold longs at current rates, at 10.95% APR.
- Open interest collapsed -48.3% in the last 24 hours, indicating aggressive liquidation or unwinding despite peak funding incentives.
- Short liquidations dominated over the same period, with liquidation imbalance at -1.00, meaning no longs were liquidated; all liquidation pressure fell on shorts.
- Leverage risk score of 53 sits at the moderate-to-elevated boundary, reflecting fragility in the current structure despite the sudden deleveraging event.
Funding at historic extremes
The aggregated funding rate of 10.95% APR represents the most stretched valuation ETHFI has traded at in the past 90 days. A funding percentile of 100 means this rate has never been exceeded in that window — it is the ceiling of recent experience. At these levels, long positions carry extraordinary carry costs; shorts are being paid handsomely to remain short. This typically reflects a market where longs have overwhelmed available shorts, forcing borrowing costs skyward as a mechanism to rebalance supply.
At 100 percentile, ETHFI funding is at its historical extreme, pricing in maximum crowding of long leverage.
This is the classic signature of a "hot" derivatives market where capital is piling into directional bets and willing to pay significant fees for the privilege. However, the timing of this peak matters crucially — it has emerged just as the market has undergone its sharpest single-day deleveraging event.
The paradox of peak rates meeting peak unwind
The most striking feature of the current ETHFI snapshot is the contradiction between funding and open interest. Open interest of $21.0M represents the total notional exposure across all exchanges. In the last 24 hours, that open interest fell -48.3% — nearly half the market's leverage has been wiped away in a single day. Yet the funding rate that supposedly incentivizes long holding has reached 100 percentile.
This disconnect suggests the deleveraging was involuntary. When funding rates spike to maximum levels, longs *should* hold tight to earn the carry. Instead, they are fleeing or being flushed. Over a 7-day horizon, the picture is less severe: open interest rose +6.1%, showing growth overall across the week. But the 24-hour collapse dominates the narrative. Something triggered a sudden, violent unwinding of roughly half the leveraged book.
Shorts bore the full weight of liquidation
The liquidation imbalance metric reveals a stark directional skew: -1.00 means the entire liquidation burden fell on shorts. When this value reaches -1.00, it indicates zero long liquidations and maximum short liquidations over the period. This is inverted from what peak funding rates would naively predict; if longs are so crowded and costly to hold, they should be the ones getting stopped out. Instead, shorts were systematically liquidated while longs (despite high carry costs) remained standing.
This suggests that as positions unwound, the underlying price likely moved against shorts — forcing margin calls on the short side even as carry rates on the long side reached their highest point. The divergence reveals a market where leverage was positioned asymmetrically: shorts were vulnerable to a rally, and that rally (or attempted rally) executed their stops.
Moderate-to-elevated risk embedded in the structure
A leverage risk score of 53 places ETHFI in the middle-to-upper range of fragility. This composite measure, which blends funding extremity, open interest concentration, and liquidation imbalance, suggests the current market is neither stable nor in acute crisis. It reflects a structure that has just undergone rapid deleveraging (which reduces risk) but retains 10.95% funding rates and a 100 percentile historical peak that signal underlying imbalance.
The 24-hour collapse has reduced the raw notional size, but the *per-unit cost* of remaining positions has not fallen in step. New entrants or holders are still paying maximum rates to maintain long exposure. The short-side liquidation bias implies that long positions, though expensive, command some directional conviction or confidence.
What would change this read
A sustained reversal of the current positioning would require several things to break. First, if aggregated funding rates normalize downward — retreating from the 100 percentile — it would signal that long crowding is easing and shorts are regaining balance. Second, if open interest stabilizes or reverses its -48.3% daily decline over the coming days, it would confirm the unwinding was a one-time flush rather than the start of a broader deleveraging cascade. Third, if liquidation imbalance swings back toward longs (away from the -1.00 extreme), it would suggest price has stopped punishing shorts and the market has achieved a more neutral risk distribution. Any combination of these would weaken the current read of stretched-but-fragile positioning. Until then, ETHFI remains a case study in extreme carry economics meeting rapid unwinding.
*Analysis generated from Quantority's live cross-exchange data pipeline. Descriptive market data, not a trade recommendation.*
Funding-spike and liquidation-cascade alerts the moment they fire, plus unlimited history and a REST API.
See what's in Pro→How to read this
| Funding APR | Annualized, OI-weighted funding. Positive = longs pay shorts (crowded longs). |
| Percentile 90d | Where current funding sits within the coin's own last 90 days (0–100). |
| Open interest | Total USD value of outstanding perpetual contracts. |
| OI change 24h / 7d | How fast leverage is entering (+) or unwinding (−) over the period. |
| Liquidation skew | Imbalance of forced closures (−1…1): + = more longs liquidated, − = more shorts. |
| Leverage risk | 0–100 composite of funding extremity, OI momentum, liquidations and volatility. |
Read next
 SNDK
SNDK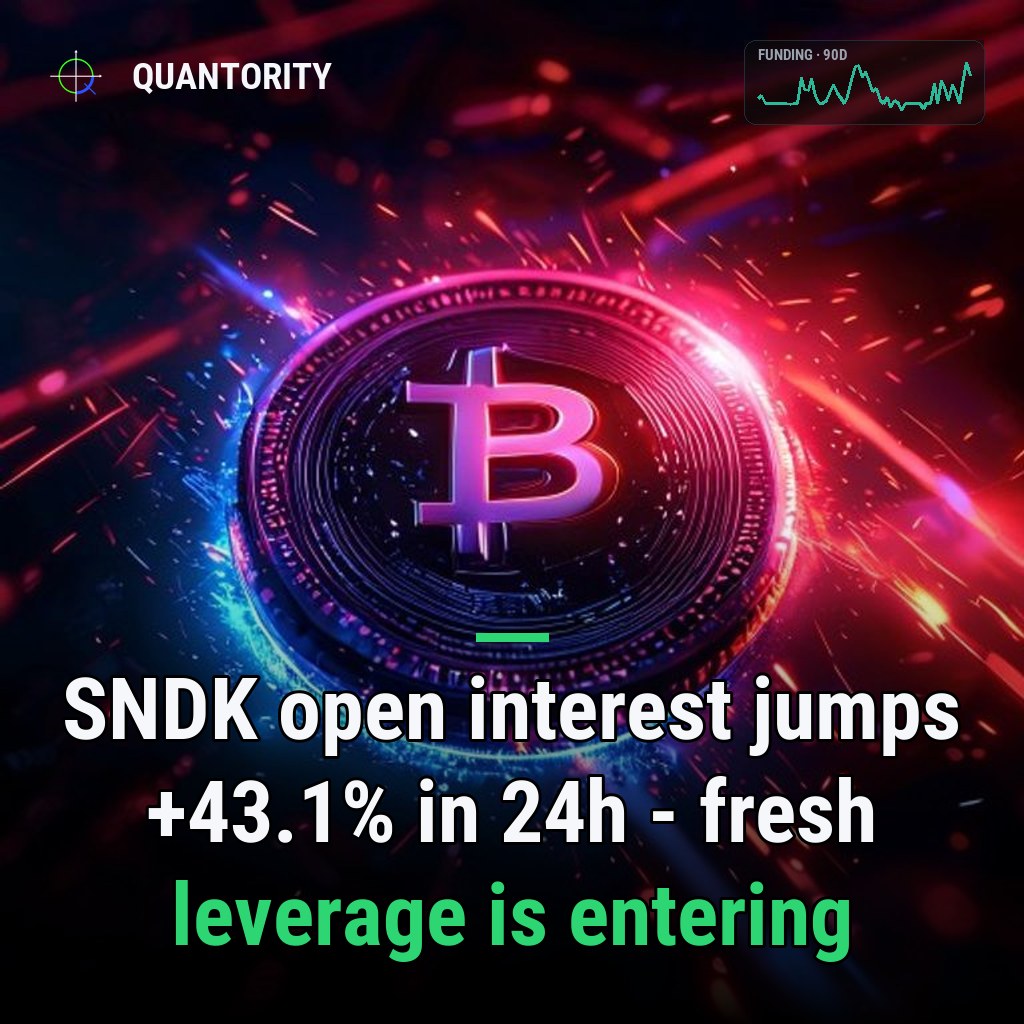
SNDK open interest jumps +43.1% in 24h — fresh leverage is entering
Total SNDK open interest now stands at $120.4M. Funding is 103.25% annualized.
 BILL
BILL
BILL open interest drops -17.3% in 24h as leverage unwinds
Total BILL open interest now stands at $11.0M. Funding is -67.35% annualized.
 GRAM
GRAM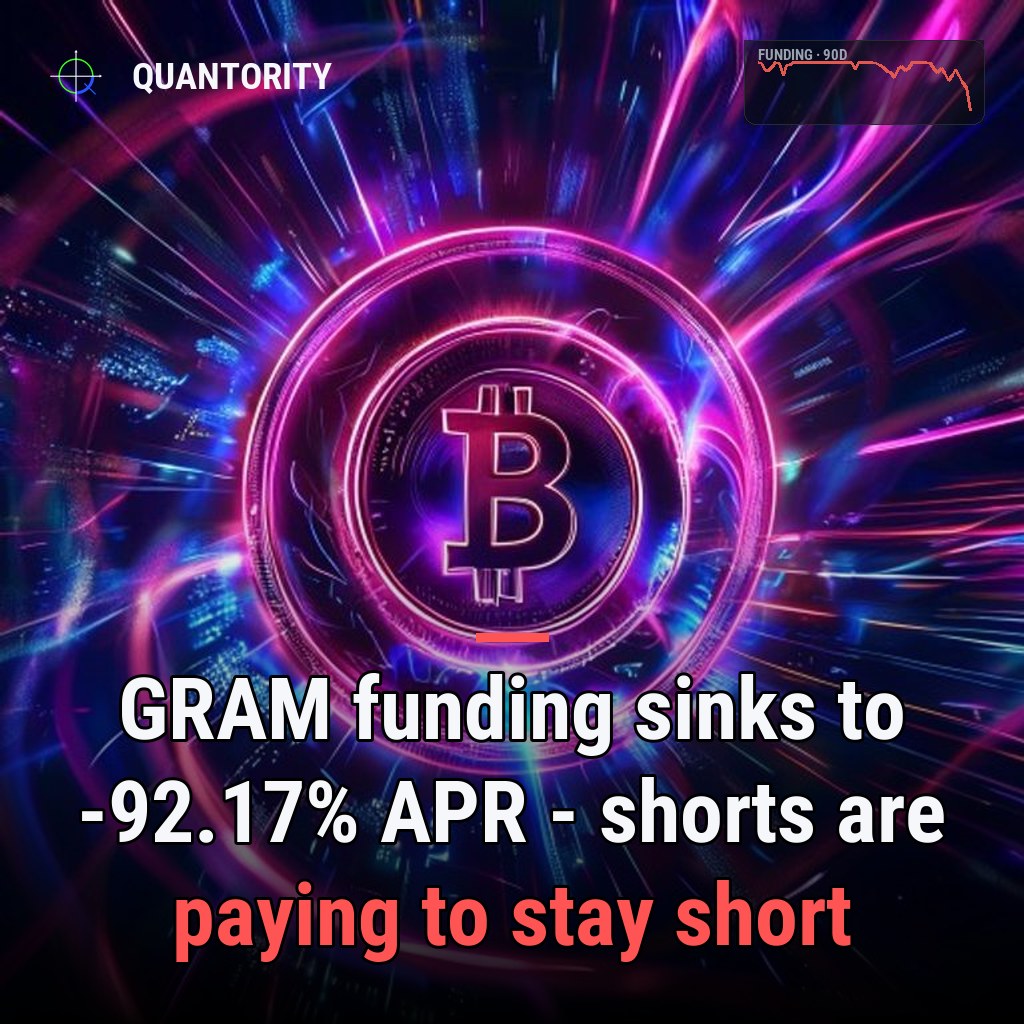
GRAM funding sinks to -92.17% APR — shorts are paying to stay short
Funding sits at the 2nd percentile of GRAM's own 90-day range, with $43.9M of open interest at stake.
Priya manages Quantority's exchange and product reviews, comparing fees, leverage limits and liquidity. Her ratings are editorial and kept independent of any affiliate arrangements.
Stretched markets, building leverage and the research worth reading — one short email.
Every figure here is read directly from Quantority's cross-exchange data. This is descriptive market analysis — a read on positioning, not a forecast, and not financial advice.