 Quantority
BANK open interest jumps +86.4% in 24h — fresh leverage is entering
Total BANK open interest now stands at $51.5M. Funding is 8.65% annualized.
 BANK
BANK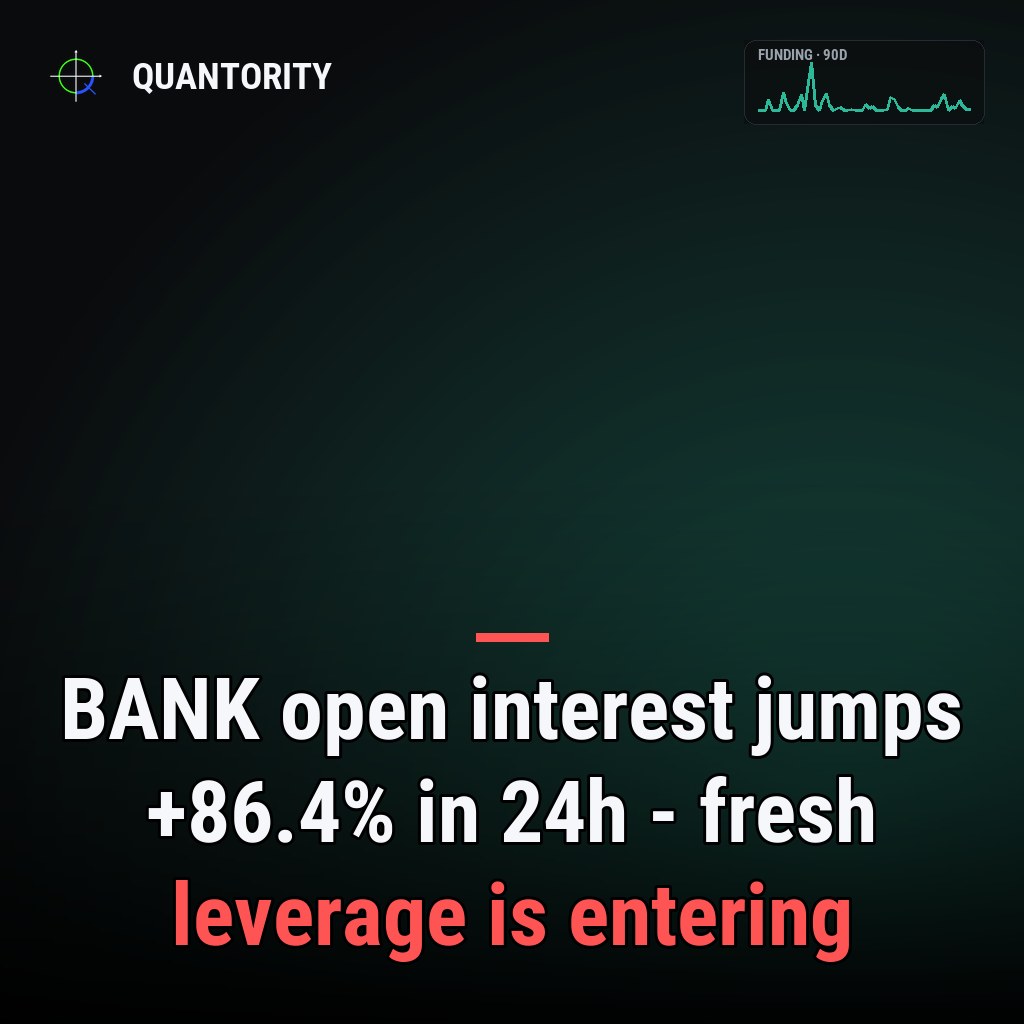
- •BANK leads with 80 leverage risk.
- •1 market covered · data as of Jul 19, 2026.
| Coin | Funding APR | Pctile 90d | Open interest | OI 24h | Risk |
|---|---|---|---|---|---|
| BANK | 8.65% | 1 | $51.5M | +86.4% | 80 |
BANK is displaying a rare combination of structural long bias and explosive leverage accumulation that marks one of the most fragile positioning setups in the current market. With annualized funding running at 8.65%, longs are paying shorts at a rate that sits at the extreme bottom of its 90-day range—yet open interest has ballooned +749.4% over the past week, a surge that contradicts the low funding percentile and suggests positioning is expanding faster than price momentum can absorb.
Key takeaways
- Funding rate of 8.65% paired with a 90-day percentile of 1 reveals a paradox: longs are paying at historically low rates for the instrument, yet continue to accumulate leverage aggressively.
- Open interest jumped +86.4% in 24 hours and +749.4% over seven days, indicating rapid leverage entry into what is already a crowded long positioning.
- The leverage risk score stands at 80, signaling elevated fragility across the combined metrics of crowding, momentum, and imbalance.
- Liquidation imbalance of +0.00 shows no directional skew in forced closures over the past 24 hours, leaving the market balanced but primed.
The funding paradox
The 8.65% annualized funding rate is unusually low for an asset where open interest is exploding. Historically, funding rates rise sharply as positioning becomes crowded and longs outweigh shorts; the fact that BANK's funding sits at percentile 1 over the last 90 days suggests this is among the cheapest borrowing costs longs have faced in recent memory. Yet rather than triggering deleveraging or deterring new long entry, the low cost appears to have activated fresh accumulation—evidenced by the open-interest surge.
Funding sits at the 1st percentile while OI has surged 749% in a week—a structural mismatch that reveals aggressive leverage entry at historically advantageous rates.
This dynamic is unstable. Funding rates typically lag spot price action and liquidation pressure. When leverage builds as rapidly as it has in BANK—without corresponding repricing of borrowing costs—the market is running on a time lag. The low percentile suggests funding has not yet caught up to the scale of new positioning, a lag that historically resolves through either sharp rate adjustment or position unwinding.
Explosive open-interest momentum
The scale of open-interest movement is the most alarming signal in the BANK setup. In seven days, notional open interest has grown by +749.4%, bringing the total to $51.5M. Over 24 hours alone, it added +86.4%. This pace of leverage accumulation is not gradual or organic; it represents rapid capital inflow into leveraged longs in an asset where the funding-rate signal—normally a brake on such behavior—remains muted.
The contrast between a relatively small absolute open-interest pool ($51.5M) and its explosive growth rate matters. BANK is not a high-liquidity derivatives market, which amplifies the impact of each new position. Leverage entering at this velocity into a shallow market creates structural risk: any reversal in spot price or funding repricing could trigger a cascade of liquidations that encounters limited buy-side absorption.
Liquidation balance and fragility
The liquidation imbalance of +0.00 indicates that over the past 24 hours, neither longs nor shorts faced disproportionate forced closure. This equilibrium, however, masks an underlying fragility: it suggests no major shake-out has yet occurred despite the aggressive leverage entry. Historically, such flat imbalance paired with extreme risk scores often precedes a one-sided liquidation event once a trigger emerges—typically a sharp spot move or a sudden jump in funding rates as the market reprices crowding.
Leverage risk at elevated threshold
The leverage risk score of 80 reflects the composite pressure from the funding paradox, the OI momentum, and the crowding metrics. This score sits well into the elevated zone, indicating the positioning is structurally fragile. The combination of cheap funding (percentile 1), explosive OI growth (+749.4% weekly), and rapid 24-hour accumulation (+86.4%) creates a scenario where the market has priced in low risk at the moment of peak positioning vulnerability.
Risk score 80 does not predict a move; it quantifies how tightly wound the setup is and how sensitive it has become to small shocks in liquidity or sentiment.
What would change this read
This configuration would begin to normalize if funding rates repriced upward materially from 8.65%, signaling the market was pricing in crowding stress. A reversal in the open-interest trend—a decline in the 24-hour or 7-day change figures—would indicate deleveraging and a release of tension. If liquidation imbalance shifted sharply negative, indicating shorts were being forced out, the long dominance would be challenged. Finally, any marked decline in the leverage risk score from 80 would suggest the composite fragility was easing. Absent these shifts, BANK positioning remains a high-tension system awaiting a repricing event.
*Analysis generated from Quantority's live cross-exchange data pipeline. Descriptive market data, not a trade recommendation.*
Funding-spike and liquidation-cascade alerts the moment they fire, plus unlimited history and a REST API.
See what's in Pro→How to read this
| Funding APR | Annualized, OI-weighted funding. Positive = longs pay shorts (crowded longs). |
| Percentile 90d | Where current funding sits within the coin's own last 90 days (0–100). |
| Open interest | Total USD value of outstanding perpetual contracts. |
| OI change 24h / 7d | How fast leverage is entering (+) or unwinding (−) over the period. |
| Liquidation skew | Imbalance of forced closures (−1…1): + = more longs liquidated, − = more shorts. |
| Leverage risk | 0–100 composite of funding extremity, OI momentum, liquidations and volatility. |
Read next
BANK
Highest leverage risk in crypto perpetuals right now
The coins our 0-100 leverage risk score flags as most stretched.
 CONL
CONL
Open interest is building fastest in these markets
Where leverage is entering quickest, by 24h open-interest change.
 SHIB
SHIB
SHIB open interest drops -60.4% in 24h as leverage unwinds
Total SHIB open interest now stands at $14.5M. Funding is 10.95% annualized.
Sofia connects on-chain flows to derivatives positioning for Quantority, tracking how stablecoin movements, exchange reserves and settlement data line up with funding and open interest.
Stretched markets, building leverage and the research worth reading — one short email.
Every figure here is read directly from Quantority's cross-exchange data. This is descriptive market analysis — a read on positioning, not a forecast, and not financial advice.