 Quantority
TAG open interest jumps +34.5% in 24h — fresh leverage is entering
Total TAG open interest now stands at $18.1M. Funding is 68.67% annualized.
 TAG
TAG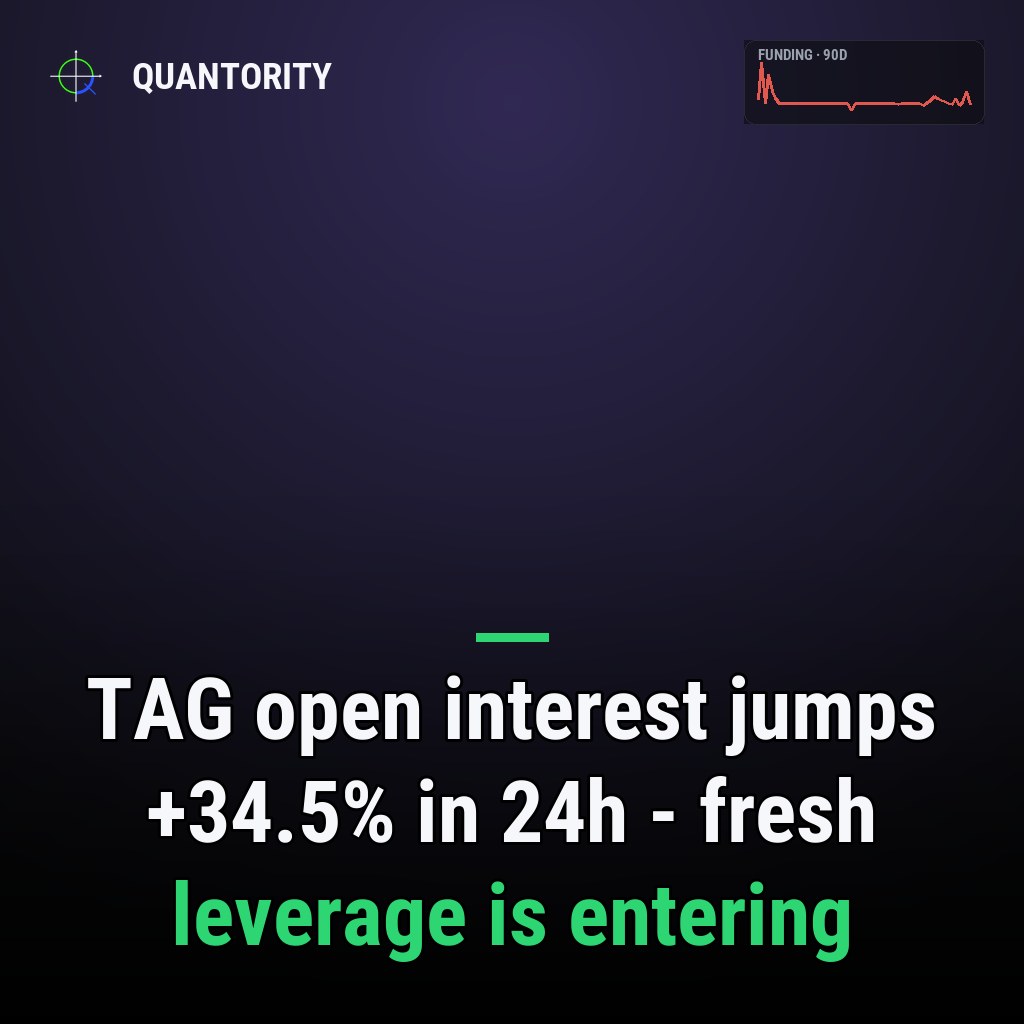
- •TAG leads with 60 leverage risk.
- •1 market covered · data as of Jul 19, 2026.
| Coin | Funding APR | Pctile 90d | Open interest | OI 24h | Risk |
|---|---|---|---|---|---|
| TAG | 68.67% | 96 | $18.1M | +34.5% | 60 |
TAG derivatives markets are flashing intense crowding signals across nearly every measure of leverage stress. The combination of extreme funding rates, historically stretched positioning, and rapid open-interest accumulation paints a picture of pronounced long-side congestion that leaves the market vulnerable to sharp reversals.
Key takeaways
- Annualized funding has reached 68.67%, placing it at the 96 percentile of TAG's 90-day range—a rare, elevated payout rate that signals longs are paying shorts at historically aggressive levels.
- Open interest surged +34.5% over the past 24 hours and +25.9% over the past week, indicating sustained leverage-building into an already crowded market.
- The leverage risk score stands at 60, reflecting moderate-to-elevated fragility in the positioning structure.
- Liquidation imbalance of +0.00 shows neutral flow so far, but with such rapid OI growth and stretched funding, the market remains primed for cascading long liquidations if price moves decisively lower.
Funding rate reaches extreme territory
TAG's annualized funding APR of 68.67% is extraordinarily high. To contextualize this within the coin's own recent history, the funding percentile of 96 means that over the past 90 days, TAG funding has rarely—if ever—climbed this steep. When a funding rate sits at the 96th percentile, it is occupying the very top of its own historical range.
A 96th percentile funding reading means long-side crowding has reached exceptional levels relative to TAG's recent trading patterns.
This is the core signal: traders holding long leveraged positions are now paying shorts at a rate almost nobody in the recent past has paid. Such lopsided compensation typically emerges when futures markets become dominated by bullish, overleveraged positioning. The rate itself functions as both a profit source for shorts and a brake on further long accumulation—yet the open-interest data suggest that brake has not yet taken hold.
Open interest acceleration into stretched waters
The open-interest backdrop amplifies the risk picture. TAG's total open interest of $18.1M is not enormous by exchange standards, but the *rate of change* is alarming. In just 24 hours, OI climbed +34.5%. Over seven days, the cumulative build stands at +25.9%.
This is not a single-day spike followed by consolidation; it is sustained, consecutive leverage entry. Traders are not waiting for funding to cool or positions to unwind—they are doubling down. When leverage accumulates this quickly into a market already exhibiting the 96th percentile funding stress, each new entrant is purchasing the right to hold a long position at increasingly onerous funding costs. The economic logic suggests this behavior is either speculative exuberance or a conviction bet that appreciation will outpace funding drain.
Neither scenario reduces near-term instability. Both suggest positioning fragility.
Liquidation balance and the latent cascade risk
The liquidation imbalance metric shows +0.00 over the last 24 hours, indicating equal or near-equal flow of long and short liquidations. This neutral reading is important: it does not suggest an active, ongoing washout of longs. Instead, it points to a *latent* risk. With open interest building at +34.5% daily and funding at the 96 percentile, the market is effectively loading ammunition into a powder keg without yet detonating it.
If price were to slip—even modestly—the cascade effect becomes plausible. Longs holding positions at high leverage ratios, already paying 68.67% annually in funding, would tip into underwater conditions. Margin calls and forced liquidation would trigger on a scale difficult to absorb, especially in a $18.1M OI pool. Liquidations would accelerate bidding liquidation of other longs, compounding the downward spiral.
Leverage risk score and composite fragility
The leverage risk score of 60 reflects elevated but not yet critical fragility. On a 0-100 scale, 60 occupies the zone above moderate, approaching elevated tension. It synthesizes the funding extremity, the speed of OI growth, and the leverage concentration into a single risk metric. It is not a "buy" or "sell" signal; it is a structural warning that the market's foundation of leverage is strained.
What would change this read
TAG's current stretched state would normalize if funding retreated sharply from the 96 percentile, signaling that long crowding had eased or reversed. A sustained decline in open interest—reversing the +34.5% and +25.9% gains—would confirm deleveraging. Additionally, if liquidation imbalance shifted decisively negative (more shorts than longs being wiped out), it would suggest the long bias was being vindicated and crowding was clearing through profitability rather than distress. Conversely, any further OI acceleration combined with a failure of funding to normalize would deepen the compressed state and raise crash risk.
*Analysis generated from Quantority's live cross-exchange data pipeline. Descriptive market data, not a trade recommendation.*
Funding-spike and liquidation-cascade alerts the moment they fire, plus unlimited history and a REST API.
See what's in Pro→How to read this
| Funding APR | Annualized, OI-weighted funding. Positive = longs pay shorts (crowded longs). |
| Percentile 90d | Where current funding sits within the coin's own last 90 days (0–100). |
| Open interest | Total USD value of outstanding perpetual contracts. |
| OI change 24h / 7d | How fast leverage is entering (+) or unwinding (−) over the period. |
| Liquidation skew | Imbalance of forced closures (−1…1): + = more longs liquidated, − = more shorts. |
| Leverage risk | 0–100 composite of funding extremity, OI momentum, liquidations and volatility. |
Read next
 SHIB
SHIB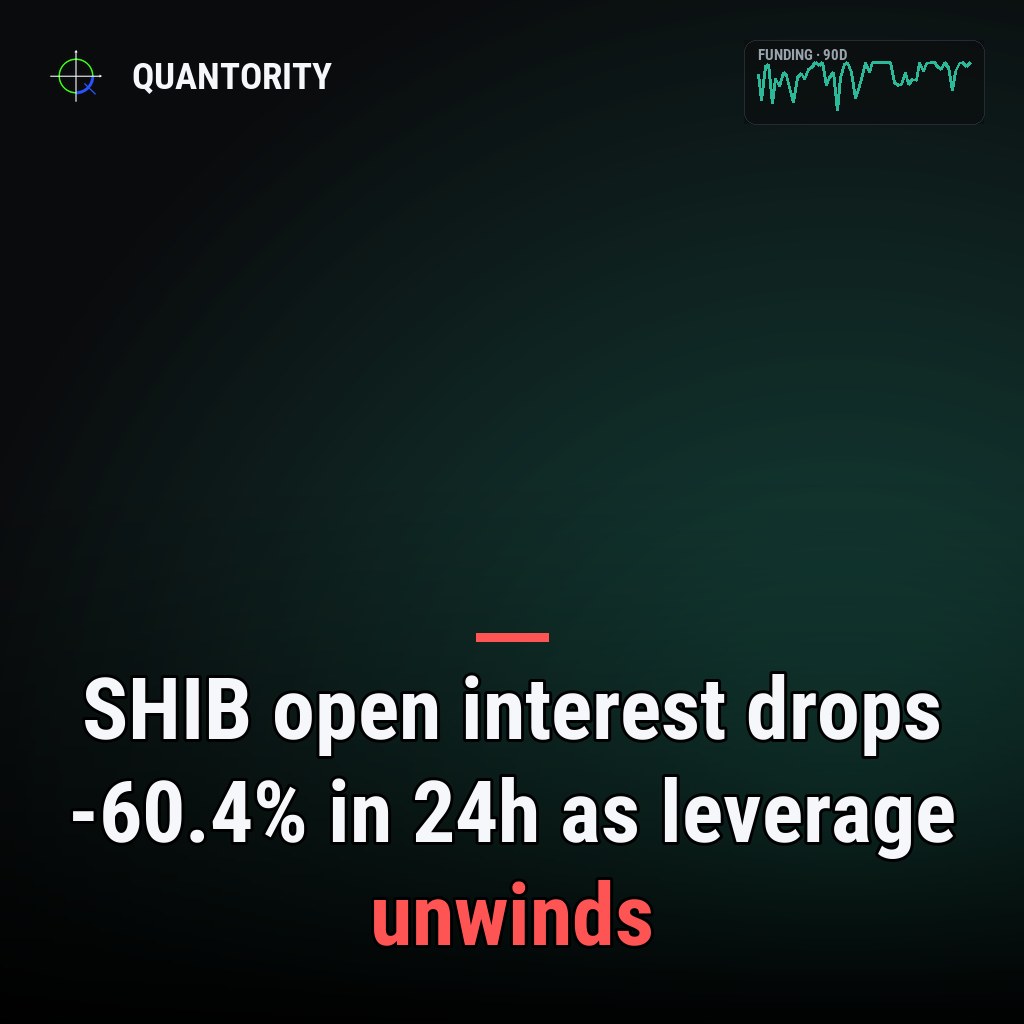
SHIB open interest drops -60.4% in 24h as leverage unwinds
Total SHIB open interest now stands at $14.5M. Funding is 10.95% annualized.
 BILL
BILL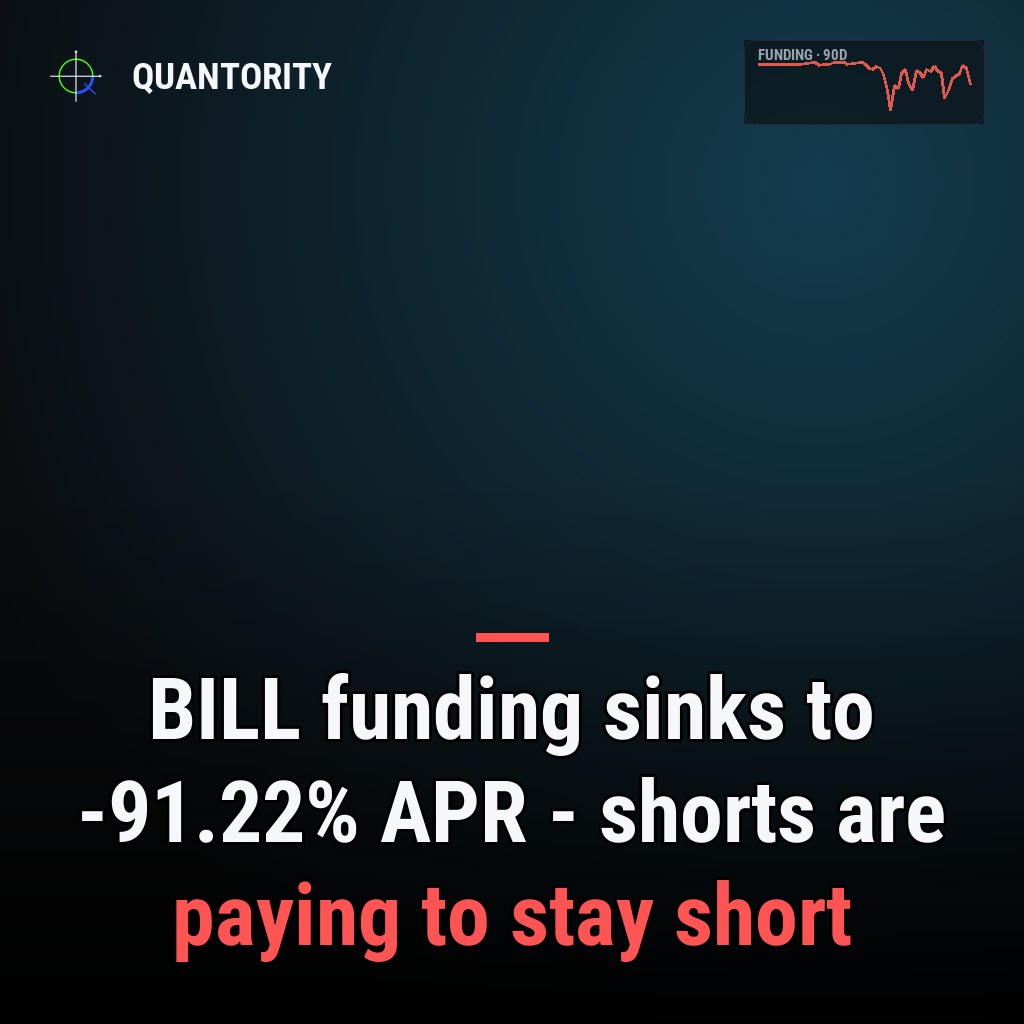
BILL funding sinks to -91.22% APR — shorts are paying to stay short
Funding sits at the 3rd percentile of BILL's own 90-day range, with $10.8M of open interest at stake.
 News
News
$8.3M crypto seizure strips ransom negotiator of XRP, Bitcoin
Federal court seized a ransom negotiator's $8.3 million crypto portfolio alongside Florida real estate in an undisclosed enforcement action.
Anika covers prediction markets and event pricing for Quantority, translating on-chain market-implied probabilities into plain-language context alongside the derivatives data.
Stretched markets, building leverage and the research worth reading — one short email.
Every figure here is read directly from Quantority's cross-exchange data. This is descriptive market analysis — a read on positioning, not a forecast, and not financial advice.