 Quantority
BILL funding sinks to -91.22% APR — shorts are paying to stay short
Funding sits at the 3rd percentile of BILL's own 90-day range, with $10.8M of open interest at stake.
 BILL
BILL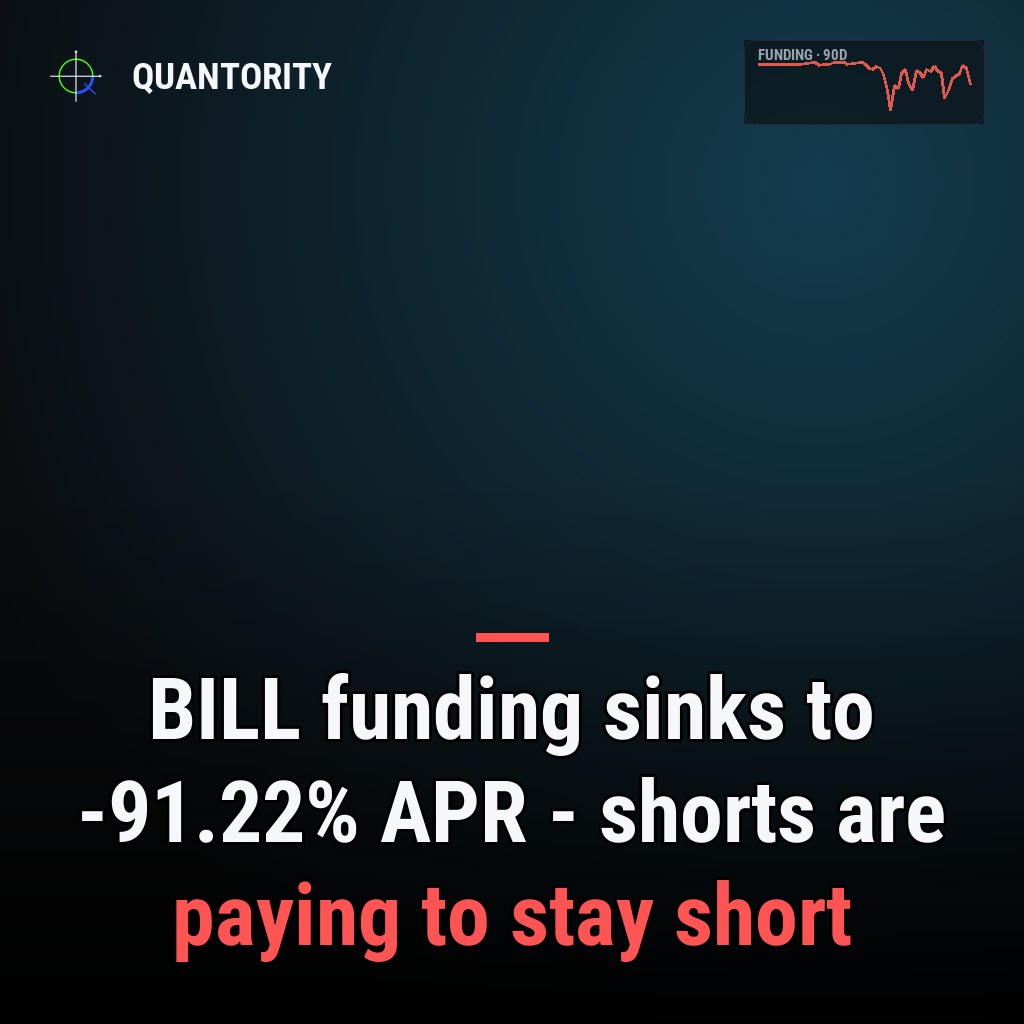
- •BILL leads with 46 leverage risk.
- •1 market covered · data as of Jul 19, 2026.
| Coin | Funding APR | Pctile 90d | Open interest | OI 24h | Risk |
|---|---|---|---|---|---|
| BILL | -91.22% | 3 | $10.8M | +10.3% | 46 |
BILL is exhibiting a rare confluence of extreme funding pressure and modest liquidation skew, suggesting that while short positioning is densely packed, the overall leverage environment remains contained. The funding rate tells a sharp story: shorts are being paid handsomely to hold their positions, yet this extreme inversion sits at the very bottom of BILL's recent funding distribution, implying the market has rarely if ever favored shorts this heavily in the past 90 days.
Key takeaways
- Aggregated funding is -91.22% APR — shorts are collecting steep compensation, indicating crowded short positioning that must be unwound or will persist as a drag on long entries.
- Funding percentile of 3 places this rate in the bottom tail of BILL's 90-day range, marking an extraordinary and historically rare setup for this asset.
- Open interest is $10.8M total notional; a +10.3% surge over 24 hours shows fresh leverage entry even as the 7-day trend is -15.6%, signaling conflicting directional signals in positioning momentum.
- Leverage risk score of 46 sits in the moderate band, suggesting the absolute fragility of positions is not yet critical despite the funding extreme.
Shorts compressed into an extreme funding cliff
The -91.22% annualized funding rate on BILL represents a structural short crowding event. When funding turns deeply negative, market makers and speculators taking short positions are paid by those holding longs, creating a steady bleed on long holders' capital. This is not a rare observation in crypto, but for BILL specifically, the 3 percentile ranking over the last 90 days places this reading at the outer edge of the distribution. In plain terms, BILL has spent most of the past three months trading at less extreme funding; shorts have rarely been compensated this lavishly.
Funding at -91.22% APR in the 3rd percentile signals that shorts are historically crowded and the cost to hold long exposure has become punitive.
This setup creates a structural imbalance. If shorts remain unwound, the negative funding will persist as a friction cost. If shorts attempt to close or roll positions, they must compete for liquidity, potentially forcing a rapid funding mean-reversion and a violent short squeeze. The 3 percentile reading is the critical detail: it confirms this is not a normal financing environment for BILL, but a tail event.
Conflicting signals in open interest momentum
The total open interest of $10.8M sits in a state of internal contradiction. Over the past 24 hours, open interest has grown +10.3%, suggesting fresh leverage is entering the market — likely from traders betting against the crowded shorts or anticipating a move. Yet over the past seven days, open interest has fallen -15.6%, indicating that the medium-term trend has been deleveraging and position unwinding.
This mismatch matters because it suggests intraday capitulation or short-covering counterbalancing a longer-term pullback in overall positioning. The 24-hour surge could reflect tactical longs attempting to position ahead of potential short-covering, or it could be noise layered atop genuine structural reduction. The 7-day decline, however, points to a market gradually stepping back from BILL, which in a context of -91.22% funding becomes a worrying signal: if leverage is already falling while shorts are still being paid at extreme rates, the positioning may be even more fragile than the absolute funding level suggests.
Liquidation imbalance points to mild long exposure
The liquidation imbalance stands at +0.11 over the past 24 hours, a modest positive reading. This means slightly more longs were liquidated than shorts, but the magnitude is small and does not suggest a violent cascade in either direction. With open interest low relative to major assets (at $10.8M), absolute liquidation volumes are limited, so this reading reflects a balanced, if slightly long-biased, pressure environment.
The fact that liquidations are not heavily skewed toward longs despite the punitive funding rate suggests that those holding longs are either well-capitalized or have exited in advance. Conversely, short holders, though crowded, have not yet faced sufficient mark-to-market pressure to trigger systematic cascades.
Leverage risk score reveals contained fragility
The leverage risk score of 46 occupies a moderate band on the 0–100 scale. This is neither comfortably low nor dangerously elevated. It reflects a positioning environment that is strained — particularly given the funding extreme — but not yet acutely unstable. The score accounts for crowding, imbalance, and volatility, and 46 suggests that BILL's absolute leverage is held in check by either lower notional size, wider stop distributions, or less extreme use of margin by the aggregate short base.
This is a crucial counterweight to the funding signal: yes, shorts are historically crowded, but the systemic fragility dial is not yet in the red. It implies that a short squeeze, if it occurs, would likely unfold gradually rather than as a violent, flash-liquidation cascade.
What would change this read
If aggregated funding begins to normalize — moving substantially above the -91.22% level and climbing back toward the median of the 90-day range — the short crowding thesis would weaken. If the 7-day open interest reversal shifts to positive and open interest begins accumulating again, it would signal that leverage is re-entering despite the punitive funding, a sign of conviction rather than capitulation. Conversely, if the leverage risk score climbs substantially above 46, or if liquidation imbalance swings sharply negative (favoring more short liquidations), it would indicate that the crowded short position is beginning to unwind under its own weight. Any of these reversals would reshape the risk contours materially.
*Analysis generated from Quantority's live cross-exchange data pipeline. Descriptive market data, not a trade recommendation.*
Funding-spike and liquidation-cascade alerts the moment they fire, plus unlimited history and a REST API.
See what's in Pro→How to read this
| Funding APR | Annualized, OI-weighted funding. Positive = longs pay shorts (crowded longs). |
| Percentile 90d | Where current funding sits within the coin's own last 90 days (0–100). |
| Open interest | Total USD value of outstanding perpetual contracts. |
| OI change 24h / 7d | How fast leverage is entering (+) or unwinding (−) over the period. |
| Liquidation skew | Imbalance of forced closures (−1…1): + = more longs liquidated, − = more shorts. |
| Leverage risk | 0–100 composite of funding extremity, OI momentum, liquidations and volatility. |
Read next
 B
B
B open interest jumps +102.0% in 24h — fresh leverage is entering
Total B open interest now stands at $21.5M. Funding is 33.45% annualized.
 SHIB
SHIB
SHIB open interest drops -60.4% in 24h as leverage unwinds
Total SHIB open interest now stands at $14.5M. Funding is 10.95% annualized.
 News
News
$8.3M crypto seizure strips ransom negotiator of XRP, Bitcoin
Federal court seized a ransom negotiator's $8.3 million crypto portfolio alongside Florida real estate in an undisclosed enforcement action.
Mei-Lin leads Quantority's derivatives research, focusing on perpetual funding regimes, basis term structure and open-interest dynamics across major venues. She previously built futures analytics at an institutional market-data desk.
Stretched markets, building leverage and the research worth reading — one short email.
Every figure here is read directly from Quantority's cross-exchange data. This is descriptive market analysis — a read on positioning, not a forecast, and not financial advice.