 Quantority
SHIB open interest drops -60.4% in 24h as leverage unwinds
Total SHIB open interest now stands at $14.5M. Funding is 10.95% annualized.
 SHIB
SHIB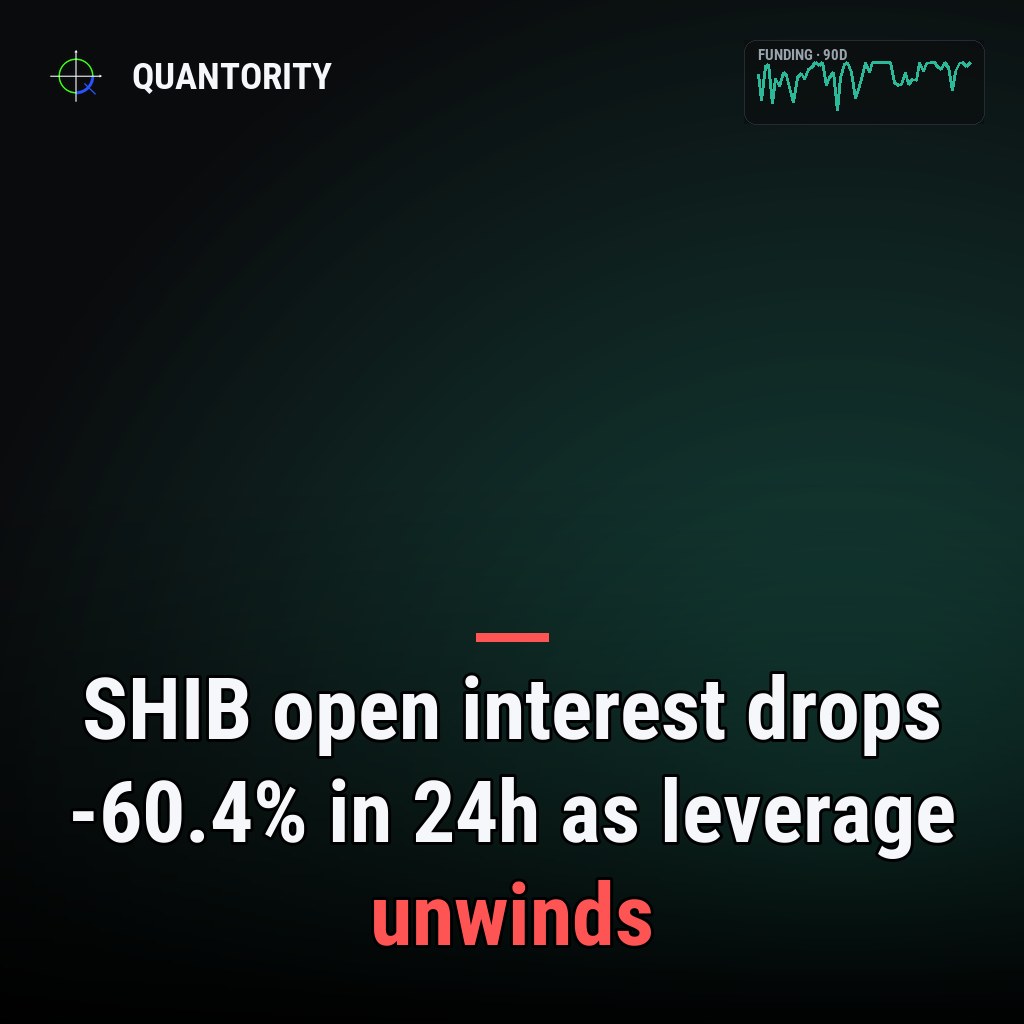
- •SHIB leads with 50 leverage risk.
- •1 market covered · data as of Jul 19, 2026.
| Coin | Funding APR | Pctile 90d | Open interest | OI 24h | Risk |
|---|---|---|---|---|---|
| SHIB | 10.95% | 100 | $14.5M | -60.4% | 50 |
Shiba Inu (SHIB) derivatives markets are flashing a mixed signal: funding rates have reached their most extreme level in 90 days, yet open interest collapsed sharply in the last 24 hours even as it rose over the past week. The combination suggests positioning is stretched but fragile, with traders rotating in and out rapidly rather than building sustained conviction. The leverage risk score remains moderate, but the structural instability—extreme funding paired with violent OI swings—warrants close attention.
Key takeaways
- Funding rate at 10.95% sits at the 100 percentile of the past 90 days, marking the highest point in recent history and signaling acute long crowding.
- Open interest plunged -60.4% in 24 hours despite a +15.4% climb over seven days, revealing whipsaw volatility and unstable positioning.
- Liquidation imbalance stands at -0.00, showing perfectly balanced liquidations with no directional skew toward longs or shorts.
- Leverage risk score of 50 indicates moderate fragility, not yet critical but consistent with elevated crowding stress.
Funding rate reaches 90-day extreme
At 10.95% annualized, SHIB funding sits at the 100th percentile of 90-day history—the most stretched it has been in months.
The aggregated funding rate across exchanges for SHIB has climbed to 10.95%, placing it at 100 percentile within the rolling 90-day window. This metric signals that long positions are paying shorts to hold their exposure, a classic hallmark of long-side crowding and elevated leverage demand. Traders are willing to pay a premium to stay long, and that premium is higher now than at any point in the past three months.
A funding rate this stretched typically reflects either euphoria, momentum chasing, or tactical leverage accumulation ahead of anticipated moves. It is not, by itself, a sell signal—funding can remain elevated for extended periods during sustained trends. However, it does establish a baseline expectation: if SHIB price suddenly turns or consolidates, the cost of holding long leverage will become onerous, forcing traders to close positions and potentially accelerating drawdowns.
Volatile open interest masks true positioning intent
The past week tells two conflicting stories. Over seven days, open interest rose +15.4%, suggesting traders were building leverage and net long exposure. Yet in the last 24 hours, open interest collapsed -60.4%, erasing much of that gain and leaving the market far smaller than it was a week ago. This violent swing is a red flag for stability.
A -60.4% single-day decline in open interest of this magnitude typically occurs during sharp liquidations, forced position closures, or sudden risk-off exits. The fact that it occurred despite positive funding (which normally encourages leverage holders to stay in) suggests the selling was driven by price movement, news, or margin calls rather than by orderly deleveraging. The contrast between the 7-day accumulation and 24-hour collapse indicates market participants lack conviction and are quick to flip from bullish to defensive positioning.
At $14.5M in total open interest, SHIB derivatives positioning remains relatively modest in absolute terms, but the volatility relative to that size is notable. Small absolute OI can experience violent percentage swings on thin liquidity, amplifying the whipsaw effect.
Liquidation balance shows no directional vulnerability
The liquidation imbalance metric for the past 24 hours is -0.00, indicating that liquidations have been perfectly balanced between long and short positions. There is no skew toward one side being flushed out more aggressively than the other. This is unusual in a market displaying such volatile OI decline, and it suggests that the -60.4% drop came from a mix of both long and short closures, rather than a one-sided cascade.
A balanced liquidation profile can mean either that leverage was evenly distributed or that exits were orderly and diversified. It also means there is no obvious "weak hand" being pushed out—both sides are reducing exposure simultaneously, which typically signals uncertainty rather than capitulation.
Moderate leverage risk score despite stretched funding
The leverage risk score stands at 50, a midpoint reading that reflects moderate fragility. This score synthesizes crowding, volatility, and structural imbalance, and a value of 50 sits between healthy and elevated states. It is not alarming, but it is not comforting either.
The disconnect between the extreme funding percentile (100) and the moderate risk score (50) is instructive: it suggests that while funding is historically stretched, the absolute size and liquidation distribution of SHIB leverage do not yet rise to the level of systemic fragility. Larger markets with deeper crowding and more skewed liquidations would post higher risk scores. SHIB is stretched but not yet brittle.
What would change this read
A normalization of funding toward lower percentiles—say, below the 50th percentile—would signal that long crowding has eased and leverage demand has cooled, removing the premium cost of holding long. Open interest stabilizing around current levels after the 24-hour flush would suggest the market has found a floor and is consolidating rather than continuing to whipsaw. A rebalance in liquidation imbalance toward negative territory (more long liquidations) would indicate shorts are being washed out and long confidence is genuinely re-establishing. Conversely, a continued rise in open interest paired with funding remaining above the 90th percentile would deepen the stretched condition and raise the leverage risk score, increasing the downside tail risk.
*Analysis generated from Quantority's live cross-exchange data pipeline. Descriptive market data, not a trade recommendation.*
Funding-spike and liquidation-cascade alerts the moment they fire, plus unlimited history and a REST API.
See what's in Pro→How to read this
| Funding APR | Annualized, OI-weighted funding. Positive = longs pay shorts (crowded longs). |
| Percentile 90d | Where current funding sits within the coin's own last 90 days (0–100). |
| Open interest | Total USD value of outstanding perpetual contracts. |
| OI change 24h / 7d | How fast leverage is entering (+) or unwinding (−) over the period. |
| Liquidation skew | Imbalance of forced closures (−1…1): + = more longs liquidated, − = more shorts. |
| Leverage risk | 0–100 composite of funding extremity, OI momentum, liquidations and volatility. |
Read next
 B
B
B open interest jumps +102.0% in 24h — fresh leverage is entering
Total B open interest now stands at $21.5M. Funding is 33.45% annualized.
 BILL
BILL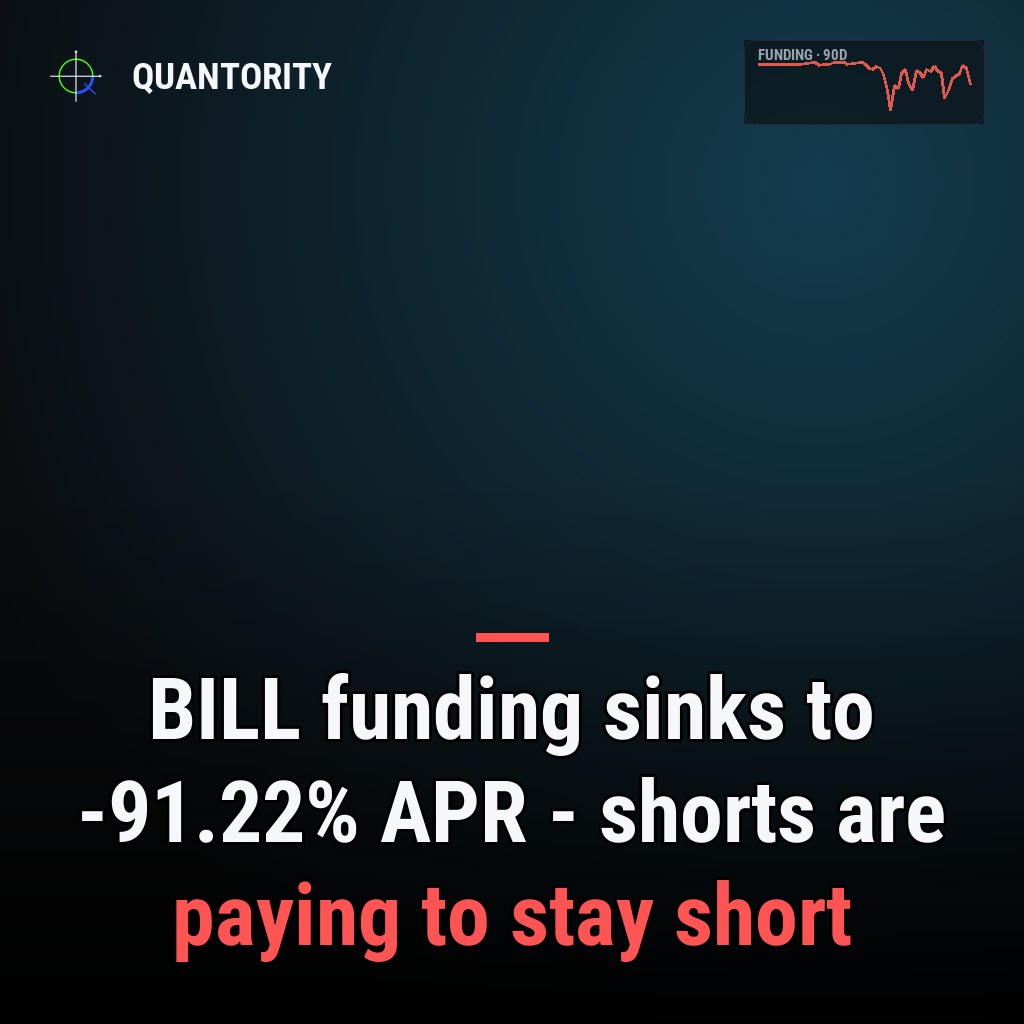
BILL funding sinks to -91.22% APR — shorts are paying to stay short
Funding sits at the 3rd percentile of BILL's own 90-day range, with $10.8M of open interest at stake.
 News
News
$8.3M crypto seizure strips ransom negotiator of XRP, Bitcoin
Federal court seized a ransom negotiator's $8.3 million crypto portfolio alongside Florida real estate in an undisclosed enforcement action.
Mei-Lin leads Quantority's derivatives research, focusing on perpetual funding regimes, basis term structure and open-interest dynamics across major venues. She previously built futures analytics at an institutional market-data desk.
Stretched markets, building leverage and the research worth reading — one short email.
Every figure here is read directly from Quantority's cross-exchange data. This is descriptive market analysis — a read on positioning, not a forecast, and not financial advice.