 Quantority
BNB open interest jumps +161.3% in 24h — fresh leverage is entering
Total BNB open interest now stands at $534.6M. Funding is 13.09% annualized.
 BNB
BNB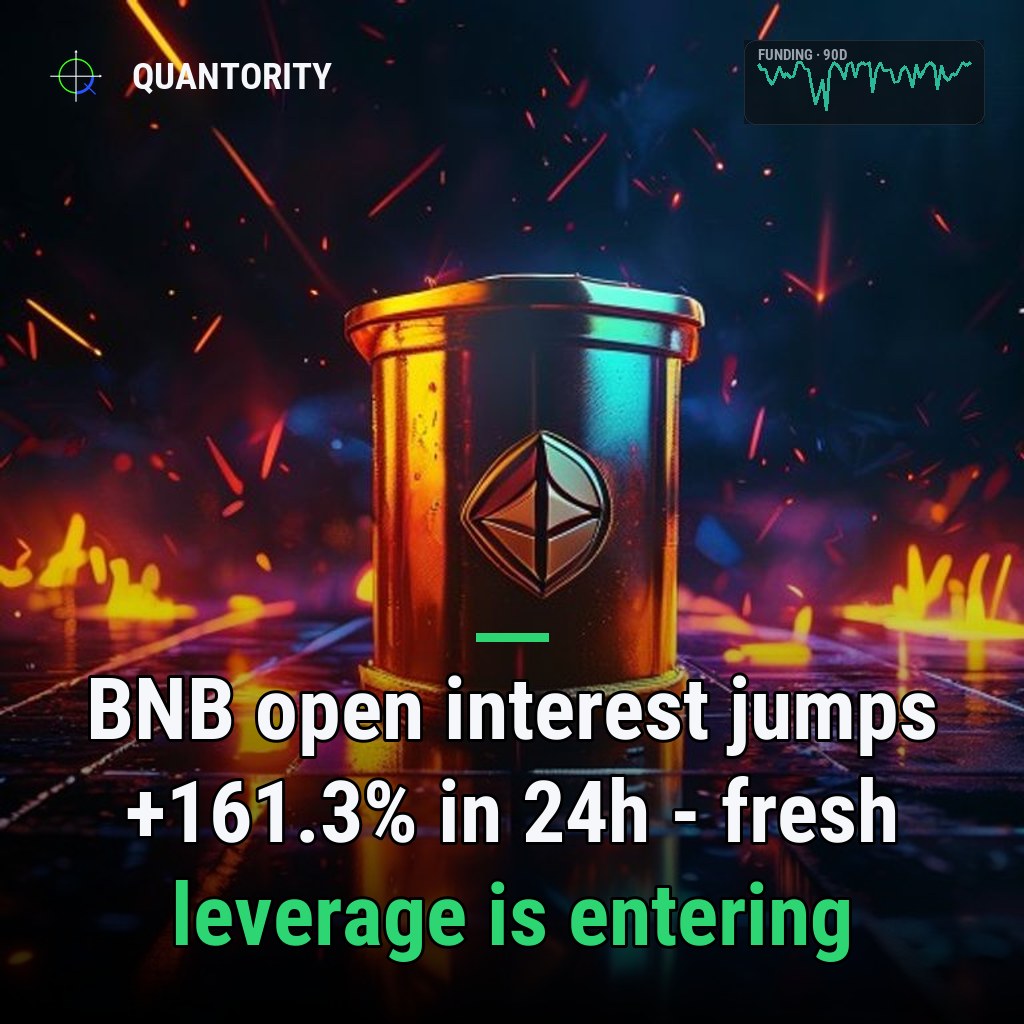
- •BNB leads with 58 leverage risk.
- •1 market covered · data as of Jul 15, 2026.
| Coin | Funding APR | Pctile 90d | Open interest | OI 24h | Risk |
|---|---|---|---|---|---|
| BNB | 13.09% | 99 | $534.6M | +161.3% | 58 |
BNB derivatives markets are flashing a sharp warning signal. Funding rates have climbed to their most stretched level in the past ninety days, while open interest has surged dramatically in a single day, creating a confluence of conditions typical of periods when leverage becomes fragile and liquidations spike unevenly. The liquidation imbalance has swung decisively toward long positions, indicating that traders holding leveraged longs face asymmetric risk—a tail outcome that could cascade rapidly if price support breaks.
Key takeaways
- Funding rate stands at 13.09% annualized, placing it at the 99 percentile of its 90-day range—a historically crowded signal for the coin.
- Open interest surged +161.3% in 24 hours, an explosive one-day build that far outpaces the modest -0.9% decay over the wider seven-day window.
- Liquidations show a severe imbalance of +0.95, meaning longs are being wiped out at a rate that dwarfs short liquidations, concentrating directional risk.
- Leverage risk score sits at 58, indicating elevated but not yet critical fragility, though the trend and composition suggest deterioration is possible.
Funding rate at the extreme edge
The 99 percentile funding position means BNB longs are paying shorts at rates unseen in this coin's recent history.
At 13.09% annualized, BNB's aggregated funding rate reflects a market in which long positions have become the crowded trade. When funding reaches the 99 percentile over a rolling ninety-day window, it signals that current conditions are near the top of the coin's typical range—a reliable marker of stretched positioning. This level of funding compensation is paid by longs to shorts continuously; sustained over weeks, it erodes profitability for leveraged long holders and creates an incentive for shorts to enter or hold positions, even as price may be rising. The implication is that buying pressure and leverage are not in equilibrium; instead, conviction and capital concentration have drifted heavily toward one side.
The explosive one-day open interest move
The +161.3% jump in open interest over the past twenty-four hours is the most immediate alarm in this dataset. Open interest nearly doubled and a half in a single day, a pace far faster than typical volatility in derivatives positioning. This surge indicates that traders are either opening new leveraged long or short positions, or rolling existing positions into higher sizes—or both. The fact that the seven-day change stands at only -0.9%, a near-flat level, tells us that this explosive build occurred almost entirely in the most recent twenty-four hours, making it a sharp inflection rather than a gradual trend.
Such rapid open interest builds often precede liquidation events, particularly if they are driven by confidence that may not be anchored to fundamental shifts. When OI grows this quickly and funding is already at the ninety-ninth percentile, the market structure becomes brittle: positions are leveraged, price is priced for continued conviction, and a sudden reversal or volatility spike can trigger a cascade of stop-losses and margin calls.
Liquidation imbalance favors shorts
The liquidation imbalance of +0.95 is the most telling directional marker. This figure, ranging from -1 to +1 over the preceding twenty-four hours, measures the net flow of liquidations: positive values mean longs are being liquidated at a higher rate than shorts; negative values indicate shorts are being wiped out. At +0.95, the imbalance is nearly maximally skewed toward long liquidations, meaning that for every short position being forcibly closed, many more longs are hitting liquidation cascades.
This asymmetry creates a secondary risk: once a portion of longs are liquidated, their exit orders hit the market, potentially pushing price lower and triggering further long liquidations in a self-reinforcing cycle. Shorts, by contrast, have far less immediate pressure, allowing them to hold or even add positions at favorable prices if the sell-off accelerates. This structural setup amplifies the danger for long-heavy leverage positioning.
Leverage risk score and interpretation
BNB's leverage risk score of 58 places the coin in the elevated range, indicating that the combination of funding stretch, OI growth, and liquidation imbalance has created meaningful fragility. A score at this level is neither at crisis nor at equilibrium; it is a yellow flag that becomes dangerous when combined with external shocks—sharp intraday volatility, regulatory news, or a sudden demand drop. The score alone might not justify panic, but layered on top of the ninety-ninth percentile funding and the one-day OI explosion, it reinforces a pattern of crowding and leverage vulnerability.
What would change this read
This configuration would normalize or reverse if funding rates decline meaningfully—especially if the funding percentile falls back toward the middle of the ninety-day distribution. A sustained drop in open interest, particularly a + or sharp reversal in the 24-hour and 7-day changes, would also indicate that leverage is being unwound and positions are closing rather than opening. Liquidations rebalancing—meaning the imbalance swings back toward 0.0, with shorts and longs being liquidated at more equal rates—would signal that price action is no longer systematically wiping out one side. Finally, if leverage risk score declines while funding normalizes, confidence in the current setup would reasonably weaken.
*Analysis generated from Quantority's live cross-exchange data pipeline. Descriptive market data, not a trade recommendation.*
Funding-spike and liquidation-cascade alerts the moment they fire, plus unlimited history and a REST API.
See what's in Pro→How to read this
| Funding APR | Annualized, OI-weighted funding. Positive = longs pay shorts (crowded longs). |
| Percentile 90d | Where current funding sits within the coin's own last 90 days (0–100). |
| Open interest | Total USD value of outstanding perpetual contracts. |
| OI change 24h / 7d | How fast leverage is entering (+) or unwinding (−) over the period. |
| Liquidation skew | Imbalance of forced closures (−1…1): + = more longs liquidated, − = more shorts. |
| Leverage risk | 0–100 composite of funding extremity, OI momentum, liquidations and volatility. |
Read next
 ARC
ARC
ARC open interest jumps +15.1% in 24h — fresh leverage is entering
Total ARC open interest now stands at $30.1M. Funding is 83.78% annualized.
 MET
MET
MET open interest jumps +55.1% in 24h — fresh leverage is entering
Total MET open interest now stands at $11.4M. Funding is -0.67% annualized.
 SKHY
SKHY
SKHY open interest jumps +56.4% in 24h — fresh leverage is entering
Total SKHY open interest now stands at $33.7M. Funding is -26.46% annualized.
Sofia connects on-chain flows to derivatives positioning for Quantority, tracking how stablecoin movements, exchange reserves and settlement data line up with funding and open interest.
Stretched markets, building leverage and the research worth reading — one short email.
Every figure here is read directly from Quantority's cross-exchange data. This is descriptive market analysis — a read on positioning, not a forecast, and not financial advice.