 Quantority
ZBT open interest drops -57.3% in 24h as leverage unwinds
Total ZBT open interest now stands at $12.5M. Funding is -40.49% annualized.
 ZBT
ZBT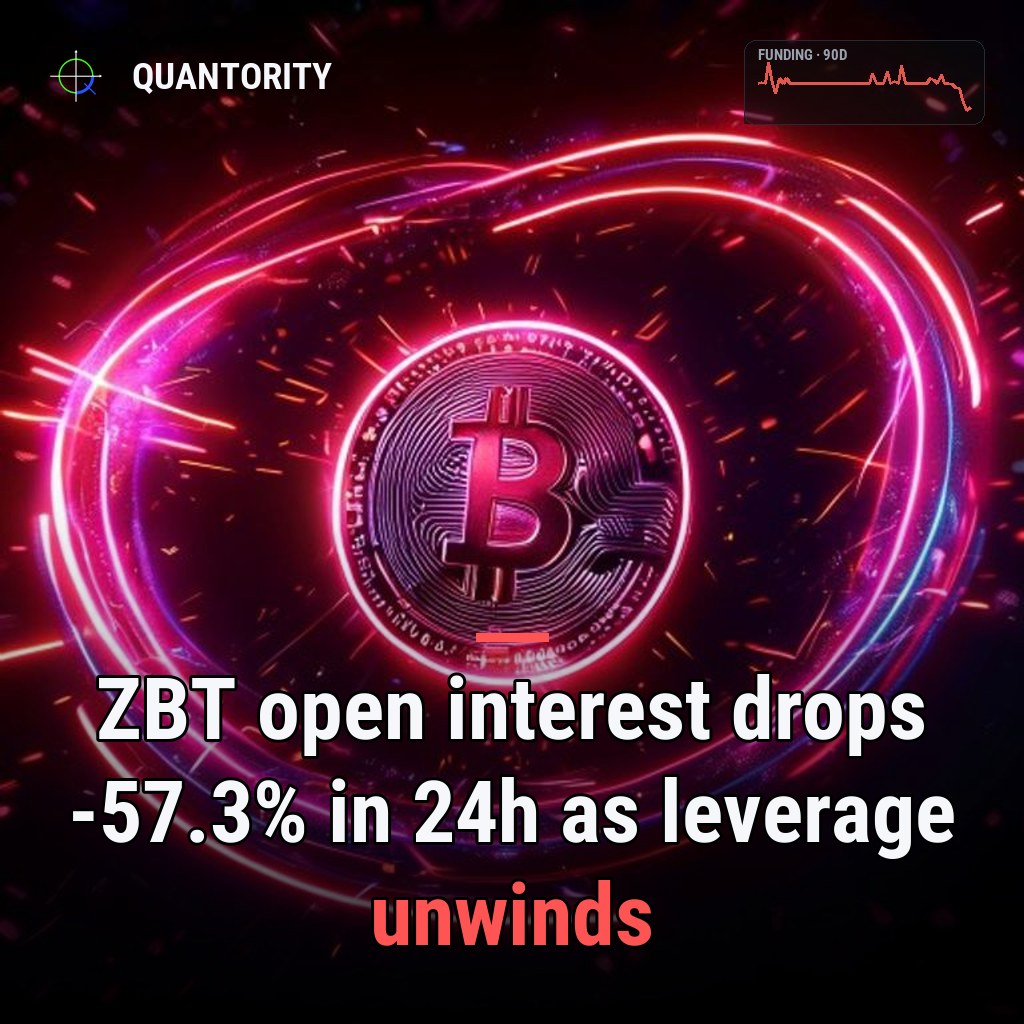
- •ZBT leads with 59 leverage risk.
- •1 market covered · data as of Jul 15, 2026.
| Coin | Funding APR | Pctile 90d | Open interest | OI 24h | Risk |
|---|---|---|---|---|---|
| ZBT | -40.49% | 2 | $12.5M | -57.3% | 59 |
ZBT is experiencing a sharp reversal in leverage positioning, marked by a rare and deeply negative funding rate paired with near-historic lows in its 90-day percentile. The data reveals that shorts have become so crowded relative to longs that they are now paying significant subsidies to hold their positions—a signal typically seen at market extremes. Simultaneously, open interest has collapsed, suggesting either a flight from the pair or forced liquidations. This combination points to positioning that was recently stretched in one direction (shorts) and is now unwinding rapidly.
Key takeaways
- Funding rate of -40.49% annualized means shorts are paying longs aggressively; this rate ranks at the 2 percentile of ZBT's 90-day range, placing it near the absolute floor of recent history.
- Open interest has fallen -57.3% in 24 hours and -63.1% over 7 days, signaling rapid deleveraging or liquidation cascade across the market.
- Liquidation imbalance stands at -0.53, indicating more shorts have been liquidated than longs over the past day, consistent with the short squeeze narrative.
- Leverage risk score of 59 reflects elevated fragility in the remaining positions, suggesting the market has not yet fully stabilized despite the dramatic unwind.
The short squeeze in funding data
ZBT's funding rate of -40.49% APR is extreme by any standard. A negative funding rate means shorts are paying longs to hold their positions—a reversal of the typical crowded-long dynamic seen in bull markets. This happens when short positions accumulate to such an extent that market makers and exchanges must incentivize long holders to balance the book. The funding percentile of 2 is the key context: it places today's rate in the lowest 2 percent of all readings ZBT has posted over the last 90 days. This is not merely negative; it is historically depressed for this coin.
A funding rate at the 2 percentile of its 90-day range signals positioning so imbalanced that shorts are now subsidizing longs at near-record intensity.
This structure typically emerges after a sustained period in which one side (in this case, shorts) has built dominant leverage. The severity of the payout suggests the short position had become very crowded before the unwind began.
Collapse in open interest
The most striking statistic is the 24-hour decline in open interest: -57.3% in just one day. Over a full week, the figure falls to -63.1%, meaning that roughly two-thirds of ZBT's derivative positioning has been liquidated or voluntarily closed in seven days. Open interest itself stands at $12.5M, indicating that the remaining notional exposure is modest—ZBT is not a large derivatives market.
This magnitude of deleveraging suggests either a coordinated exit by large traders or a cascade of forced liquidations. A -57.3% move in 24 hours is not gradual position management; it implies panic or systematic unwinding. Combined with the negative funding rate, the picture is clear: shorts are being forced out, and the market structure is collapsing as they do.
Liquidation skew and the shorts' exit
The liquidation imbalance of -0.53 confirms that shorts have borne the brunt of the unwinding. A negative value means more shorts were liquidated than longs over the past 24 hours. This aligns perfectly with the negative funding narrative: shorts accumulated heavily, funding went deeply negative (forcing them to pay to maintain positions), and then liquidations followed as positions were underwater or margin ran thin.
The magnitude—-0.53 on a scale from -1 to +1—indicates moderate-to-heavy short liquidation pressure. This is not a balanced exit; it is directionally skewed. Longs have largely been spared, while shorts have taken the losses.
Elevated but declining leverage risk
ZBT's leverage risk score of 59 sits in the elevated range, reflecting fragility in the current structure. However, this number must be read against the backdrop of the 24-hour and 7-day deleveraging. A score of 59 after a -57.3% collapse in open interest suggests the remaining positions are tighter than they were a week ago, but still carry meaningful risk. The score likely reflects the rapid unwind itself—thinning liquidity, wider spreads, and residual leverage in hands that have not yet exited.
As more shorts exit and open interest stabilizes, this score should decline. The risk at this moment is not new leverage entering; it is whether the exodus is complete or whether further waves of liquidation could cascade through the residual $12.5M in open interest.
What would change this read
A recovery in open interest combined with normalization of the funding rate would signal that the unwind has stabilized and new participants are entering. If funding returns toward neutral territory and the liquidation imbalance swings positive (more longs liquidated), the squeeze would be complete and a new regime would be forming. Conversely, if the funding percentile climbs above 2 while remaining negative, it would indicate shorts are still being purged but at a slower pace, extending the transition. Any rise in the leverage risk score alongside rising open interest would suggest new leverage is entering and elongating the next cycle.
*Analysis generated from Quantority's live cross-exchange data pipeline. Descriptive market data, not a trade recommendation.*
Funding-spike and liquidation-cascade alerts the moment they fire, plus unlimited history and a REST API.
See what's in Pro→How to read this
| Funding APR | Annualized, OI-weighted funding. Positive = longs pay shorts (crowded longs). |
| Percentile 90d | Where current funding sits within the coin's own last 90 days (0–100). |
| Open interest | Total USD value of outstanding perpetual contracts. |
| OI change 24h / 7d | How fast leverage is entering (+) or unwinding (−) over the period. |
| Liquidation skew | Imbalance of forced closures (−1…1): + = more longs liquidated, − = more shorts. |
| Leverage risk | 0–100 composite of funding extremity, OI momentum, liquidations and volatility. |
Read next
 ARC
ARC
ARC open interest jumps +15.1% in 24h — fresh leverage is entering
Total ARC open interest now stands at $30.1M. Funding is 83.78% annualized.
 MET
MET
MET open interest jumps +55.1% in 24h — fresh leverage is entering
Total MET open interest now stands at $11.4M. Funding is -0.67% annualized.
 SKHY
SKHY
SKHY open interest jumps +56.4% in 24h — fresh leverage is entering
Total SKHY open interest now stands at $33.7M. Funding is -26.46% annualized.
Mei-Lin leads Quantority's derivatives research, focusing on perpetual funding regimes, basis term structure and open-interest dynamics across major venues. She previously built futures analytics at an institutional market-data desk.
Stretched markets, building leverage and the research worth reading — one short email.
Every figure here is read directly from Quantority's cross-exchange data. This is descriptive market analysis — a read on positioning, not a forecast, and not financial advice.