 Quantority
IBM open interest jumps +225.0% in 24h — fresh leverage is entering
Total IBM open interest now stands at $10.3M. Funding is 36.82% annualized.
 IBM
IBM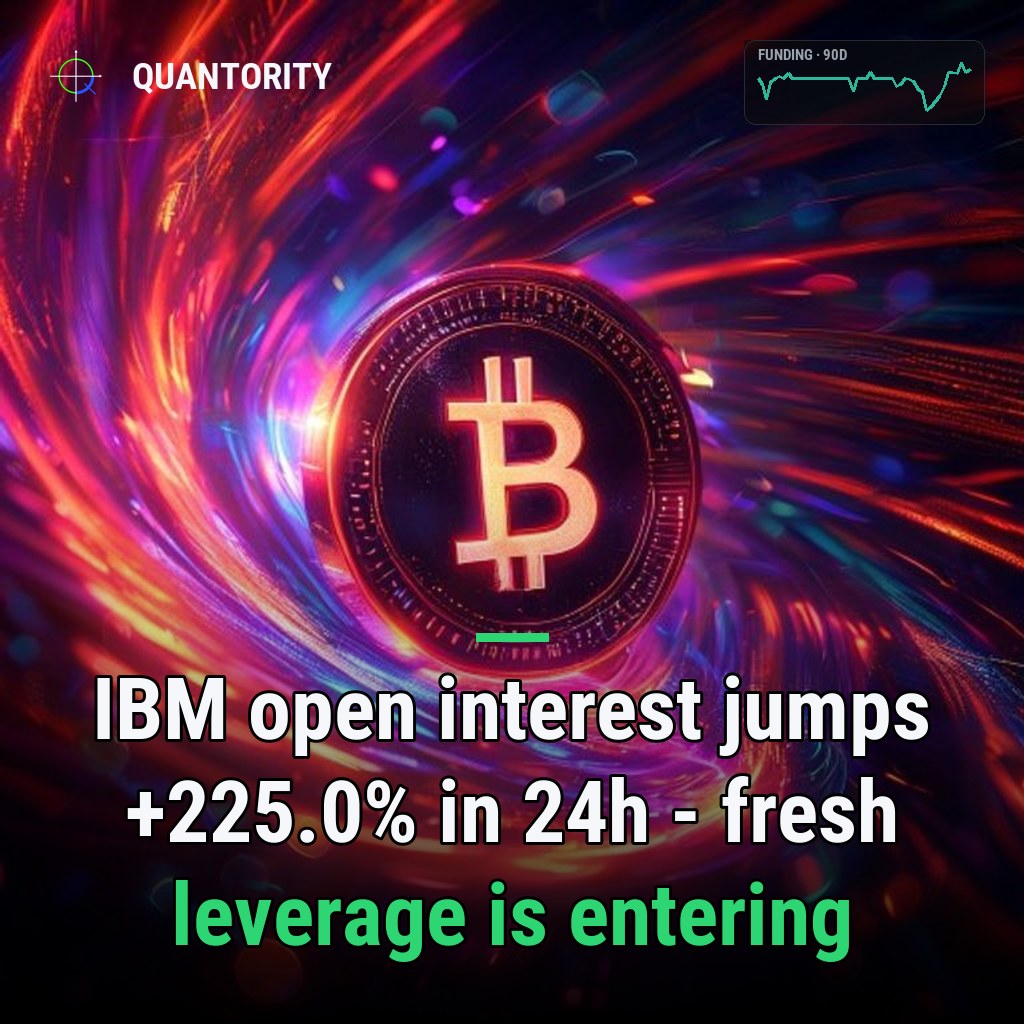
- •IBM leads with 62 leverage risk.
- •1 market covered · data as of Jul 15, 2026.
| Coin | Funding APR | Pctile 90d | Open interest | OI 24h | Risk |
|---|---|---|---|---|---|
| IBM | 36.82% | 94 | $10.3M | +225.0% | 62 |
IBM derivatives markets are flashing a rare combination of crowded positioning and extreme short-side liquidation pressure. Funding rates have climbed to 36.82% annualized—placing the market at the 94 percentile of its own 90-day range—while open interest has rocketed +225.0% in the past day and +237.7% over the week. At the same time, shorts are being purged at an intensity signal by a liquidation imbalance of -0.83, suggesting a one-sided flush of short positions. The composite leverage risk score stands at 62, indicating elevated but not yet critical fragility. Together, these signals paint a picture of explosive, lopsided leverage that has built faster than historical norms and faces acute downside tail risk.
Key takeaways
- Funding rate of 36.82% at the 94 percentile marks the highest cost to hold longs in recent history for IBM; long sellers are capturing exceptional carry.
- Open interest surged +225.0% in 24 hours and +237.7% over 7 days, implying lever has been added at blinding speed into what is already a crowded long positioning environment.
- Liquidation imbalance of -0.83 shows shorts are being liquidated far more aggressively than longs, suggesting the long crowd is price-insensitive and leveraged to the point of underwater exposure.
- Leverage risk score of 62 reflects an elevated but not yet maximum-severity positioning fragility, with room for further deterioration if momentum persists.
Funding rate at historic stretch
The annualized funding rate of 36.82% is the most concrete signal that IBM derivatives longs are both numerous and willing to pay dearly to stay long. At the 94 percentile, this rate sits in the top tier of its last 90 days, meaning the market has rarely been this expensive for bulls to hold positions. Funding rates of this magnitude do not occur in thin, balanced markets; they reflect a consensus that longs are crowded and shorts are scarce enough to command premium compensation.
A funding rate of 36.82% at the 94th percentile means longs are paying shorts nearly 37% annually—a sign of extreme long-side crowding.
The persistence of such a high rate also tells us that even at punitive levels, fresh longs continue to enter. This is the hallmark of a market where narrative momentum and leverage mechanics have temporarily overridden risk discipline. The data does not tell us why IBM has drawn this attention, only that shorts face an untenable cost to remain short, which naturally drives them to cover or to liquidate when prices move.
Open interest explosion and leverage buildup
The scale of the open interest moves compounds the funding signal. In just 24 hours, notional open interest expanded by +225.0%, and over the 7-day window that figure stands at +237.7%. Both metrics represent a near-tripling of aggregate leverage in the market within a week. The total notional open is currently $10.3M, a figure that may sound modest in isolation but takes on different meaning when the rate of change is this violent.
Such rapid buildup typically occurs in one of two ways: either fresh capital is flooding in during a price surge, or existing positions are being rolled and re-levered higher. In either case, the implication is the same: IBM derivatives have become the focus of carry traders, momentum chasers, or leveraged speculators who believe the move has room to run. The absence of any price data in this analysis prevents us from saying whether that belief is rational or speculative, but the speed of accumulation leaves the market vulnerable to any shift in sentiment.
Liquidation pressure and short-side flushing
The liquidation imbalance of -0.83 over 24 hours is the most directional signal in the dataset. A strong negative value means far more shorts were liquidated than longs, implying that the short side has been driven to capitulation levels. This typically occurs when a sharp price move catches underwater shorts with tight stops or insufficient margin.
The fact that shorts are being purged while funding remains at 36.82% suggests the long crowd is still willing to pay for leverage, even as counterparties are forced out. This asymmetry—longs accumulating while shorts are flushed—is the market structure most prone to violent reversals once liquidation momentum exhausts itself or when price action stalls.
Composite risk assessment
The leverage risk score of 62 sits in the elevated band, reflecting the cumulative stress from high funding, rapid OI growth, and one-sided liquidations. A score at this level signals that positioning is fragile and crowded, but not yet at the maximum fragility threshold. The score's message aligns with the narrative: IBM derivatives are priced and positioned for continued long momentum, but have little margin for disappointment.
What would change this read
The current stretched positioning would begin to normalize if aggregated funding fell materially below the 94 percentile, signaling that new long entries are cooling. Open interest deleveraging—a reversal of the +225.0% 24-hour move and +237.7% 7-day trend—would indicate either profit-taking or forced position unwinds, both of which would ease the crowding signal. A liquidation imbalance that rebalanced toward negative values (more longs liquidated) would show that the long crowd is no longer price-insensitive and has begun to face margin pressure. Any of these shifts would lower the leverage risk score and reduce tail risk. Until then, the market remains compressed and vulnerable to a shock that tests the funding rate's sustainability.
*Analysis generated from Quantority's live cross-exchange data pipeline. Descriptive market data, not a trade recommendation.*
Funding-spike and liquidation-cascade alerts the moment they fire, plus unlimited history and a REST API.
See what's in Pro→How to read this
| Funding APR | Annualized, OI-weighted funding. Positive = longs pay shorts (crowded longs). |
| Percentile 90d | Where current funding sits within the coin's own last 90 days (0–100). |
| Open interest | Total USD value of outstanding perpetual contracts. |
| OI change 24h / 7d | How fast leverage is entering (+) or unwinding (−) over the period. |
| Liquidation skew | Imbalance of forced closures (−1…1): + = more longs liquidated, − = more shorts. |
| Leverage risk | 0–100 composite of funding extremity, OI momentum, liquidations and volatility. |
Read next
 ARC
ARC
ARC open interest jumps +15.1% in 24h — fresh leverage is entering
Total ARC open interest now stands at $30.1M. Funding is 83.78% annualized.
 MET
MET
MET open interest jumps +55.1% in 24h — fresh leverage is entering
Total MET open interest now stands at $11.4M. Funding is -0.67% annualized.
 SKHY
SKHY
SKHY open interest jumps +56.4% in 24h — fresh leverage is entering
Total SKHY open interest now stands at $33.7M. Funding is -26.46% annualized.
Mei-Lin leads Quantority's derivatives research, focusing on perpetual funding regimes, basis term structure and open-interest dynamics across major venues. She previously built futures analytics at an institutional market-data desk.
Stretched markets, building leverage and the research worth reading — one short email.
Every figure here is read directly from Quantority's cross-exchange data. This is descriptive market analysis — a read on positioning, not a forecast, and not financial advice.