 Quantority
BONK open interest jumps +94.7% in 24h — fresh leverage is entering
Total BONK open interest now stands at $33.6M. Funding is -127.11% annualized.
 BONK
BONK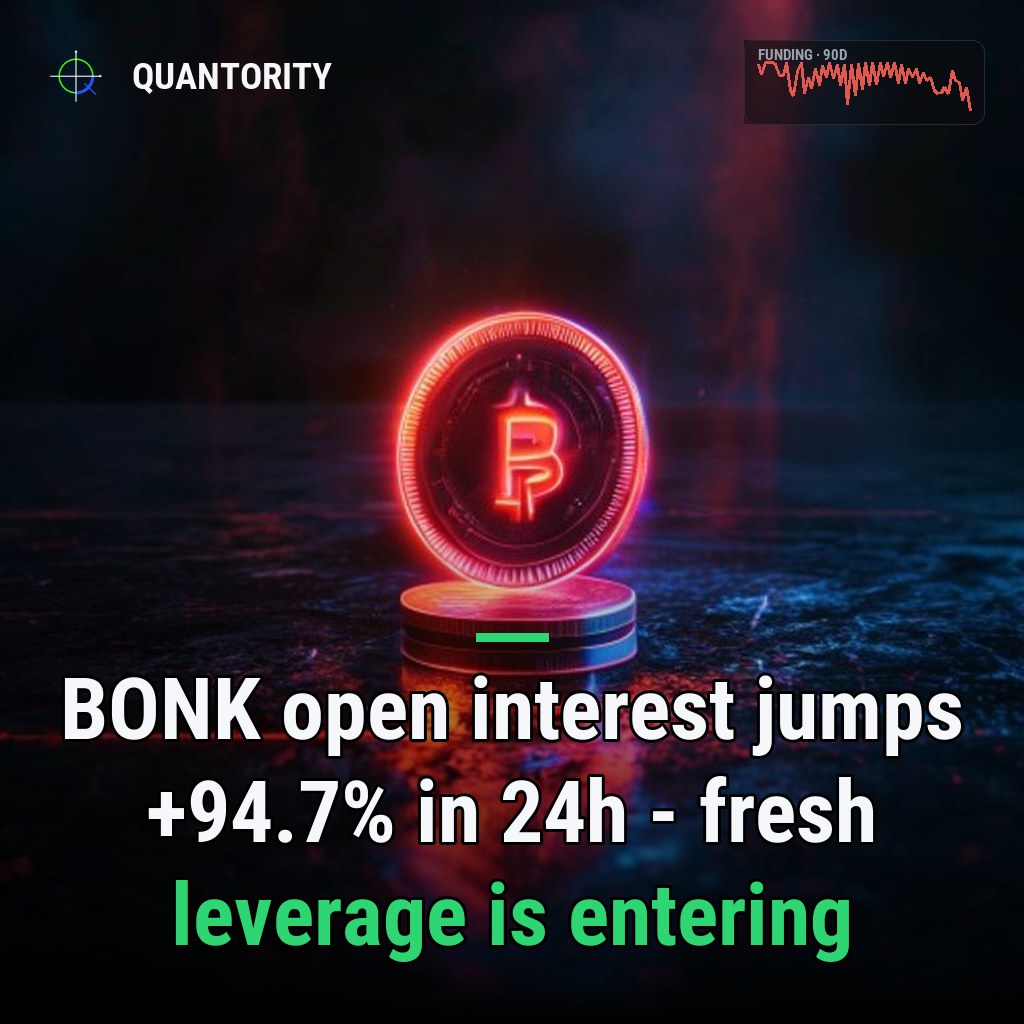
- •BONK leads with 55 leverage risk.
- •1 market covered · data as of Jul 15, 2026.
| Coin | Funding APR | Pctile 90d | Open interest | OI 24h | Risk |
|---|---|---|---|---|---|
| BONK | -127.11% | 1 | $33.6M | +94.7% | 55 |
BONK is exhibiting a rare and internally contradictory state: funding rates are collapsing to extreme shorts-favoring levels, yet open interest is exploding upward at a pace that suggests either capitulation unwinding or aggressive new leverage entry. The combination signals a market in flux, where the dominant short bias is being challenged by rapid position turnover rather than resolved through orderly liquidation.
Key takeaways
- Aggregated funding has reached -127.11% annualized, placing BONK at the 1st percentile of its 90-day range—an extreme floor where shorts are collecting payments from longs, yet this extreme is not historically deep for the asset.
- Open interest surged +94.7% in 24 hours and +13.0% over seven days, indicating heavy leverage turnover and new position building despite the short-skewed funding environment.
- Liquidation imbalance over 24 hours stands at -0.40, meaning more shorts have been liquidated than longs—a sign that the short crowding may be self-correcting through cascading closures.
- Leverage risk score of 55 places BONK in a moderate-to-elevated zone, reflecting fragility from the short concentration and rapid OI momentum.
Shorts at an extreme, but not alone
At -127.11% annualized funding, BONK shorts are being paid to hold positions—yet this sits only at the 1st percentile of recent history, meaning the crowding is extreme by local standards.
The negative funding rate tells a story of overwhelming short dominance. When funding reaches this low, traders holding short positions receive regular payments from those holding longs—a self-reinforcing signal that shorts have won the sentiment battle and longs are overstaying a position that punishes them hourly. The -127.11% rate is unambiguously short-favorable.
However, the funding percentile of 1 adds a crucial qualification: this extreme exists *within a relatively narrow band*. BONK's 90-day funding history has ranged such that today's rate ranks at only the 1st percentile—meaning the asset has spent very little time this short-crowded, and almost no time more so. This is an extreme local condition, not a historically unprecedented one. The asset may be prone to sharper swings in either direction than the percentile might initially suggest.
Open interest explosion contradicts the short narrative
The apparent paradox emerges in open-interest momentum. Over 24 hours, OI climbed +94.7%—a near-doubling that signals either panic liquidations of shorts (as longs force them out) or a rapid influx of new leverage by either side. A seven-day change of +13.0% confirms this is not a single-hour spike but a multi-day trend of position building or churn.
This velocity is inconsistent with a stable short-crowded equilibrium. If shorts were comfortably collecting -127.11% funding, we would expect OI to stabilize or contract as new participants stayed away. Instead, the market is rotating positions aggressively. The scale suggests that either the short thesis is being invalidated in real time, or longs are doubling down despite the cost—both outcomes indicate fragility and uncertainty beneath the funding surface.
Shorts capitulating, not consolidating
The liquidation imbalance of -0.40 over 24 hours reveals that more shorts have been liquidated than longs. On a normalized scale from -1 to +1, this negative skew is moderate but directional: it shows that the short crowding is not holding seamlessly. Instead, short positions are being shaken out—either by price moves, by margin pressures from funding costs, or by the friction of unwinding overleveraged stacks.
This is the mechanism by which -127.11% funding becomes self-defeating. Shorts, despite being paid, face the risk that a sustained liquidation cascade will force them to cover at worse prices or get taken out entirely. Combined with the +94.7% OI surge, this suggests an active reset: shorts are being flushed, longs are repositioning, and the market is finding a new equilibrium rather than settling into a stable short-crowded state.
Leverage risk in the middle of the range
The leverage risk score of 55 situates BONK in the elevated tier—not crisis, but notably fragile. This reflects the collision of short crowding (a crowded unwind scenario) and rapid OI turnover (a chaotic repositioning environment). The score captures the contradiction well: extreme funding suggests a one-way market, but the OI and liquidation data reveal instability, not stability. A score of 55 warns that the next few hours could see sharp reversals in either direction.
What would change this read
The current read would shift materially if funding normalized upward—moving away from -127.11% and toward zero or positive—signaling that short crowding had eased and a sustainable equilibrium was forming. Alternatively, if the 24-hour OI momentum reversed sharply (moving into negative territory), it would suggest that position turnover was complete and leverage was being withdrawn. A liquidation imbalance that swung decisively positive (favoring longs) would indicate that the short flush had ended and a new long crowding cycle was beginning. None of these have occurred yet; until they do, BONK remains in a state of unresolved positioning extremity.
*Analysis generated from Quantority's live cross-exchange data pipeline. Descriptive market data, not a trade recommendation.*
Funding-spike and liquidation-cascade alerts the moment they fire, plus unlimited history and a REST API.
See what's in Pro→How to read this
| Funding APR | Annualized, OI-weighted funding. Positive = longs pay shorts (crowded longs). |
| Percentile 90d | Where current funding sits within the coin's own last 90 days (0–100). |
| Open interest | Total USD value of outstanding perpetual contracts. |
| OI change 24h / 7d | How fast leverage is entering (+) or unwinding (−) over the period. |
| Liquidation skew | Imbalance of forced closures (−1…1): + = more longs liquidated, − = more shorts. |
| Leverage risk | 0–100 composite of funding extremity, OI momentum, liquidations and volatility. |
Read next
 ARC
ARC
ARC open interest jumps +15.1% in 24h — fresh leverage is entering
Total ARC open interest now stands at $30.1M. Funding is 83.78% annualized.
 MET
MET
MET open interest jumps +55.1% in 24h — fresh leverage is entering
Total MET open interest now stands at $11.4M. Funding is -0.67% annualized.
 SKHY
SKHY
SKHY open interest jumps +56.4% in 24h — fresh leverage is entering
Total SKHY open interest now stands at $33.7M. Funding is -26.46% annualized.
Priya manages Quantority's exchange and product reviews, comparing fees, leverage limits and liquidity. Her ratings are editorial and kept independent of any affiliate arrangements.
Stretched markets, building leverage and the research worth reading — one short email.
Every figure here is read directly from Quantority's cross-exchange data. This is descriptive market analysis — a read on positioning, not a forecast, and not financial advice.